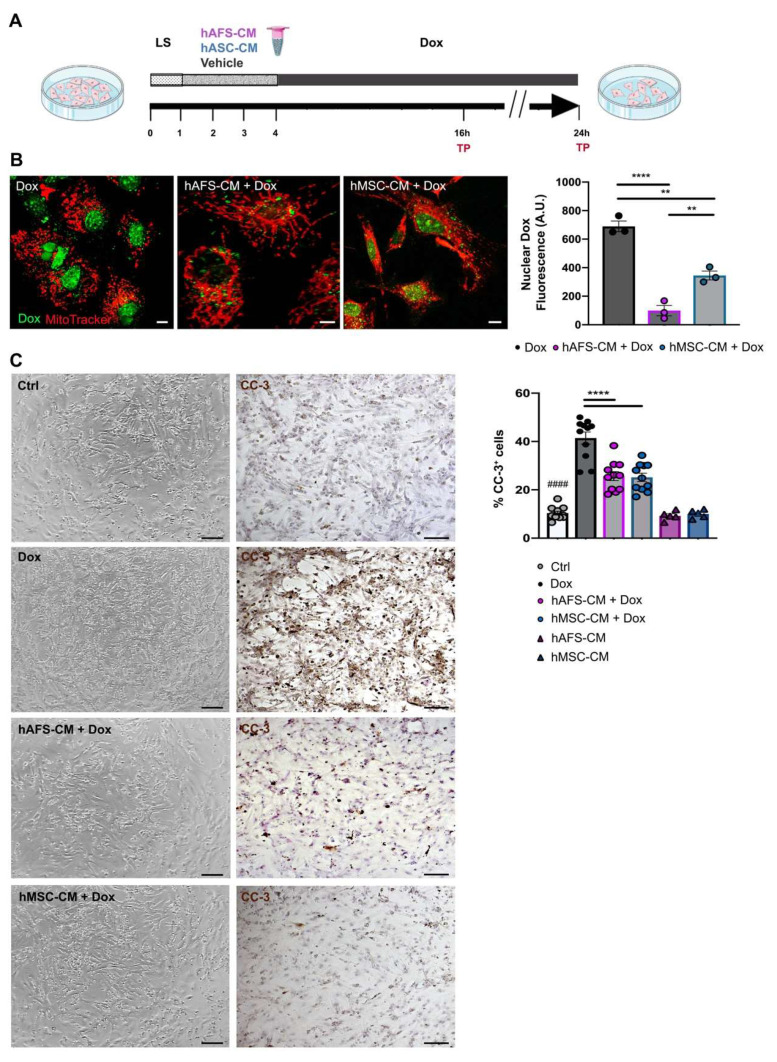
Figure 1.
hAFS and hMSC secretome formulations exert cardioprotective effects on mNVCM exposed to Dox. (A) Schematic of the experimental design for in vitro experiments. (B) Left panel: representative confocal images of live mNVCM exposed to 1 µM Dox for 16 h with or without (Dox) prior priming with hAFS-CM (hAFS-CM + Dox) or hMSC-CM (hMSC-CM + Dox) for 3 h. Mitochondria are represented in red by the MitoTracker signal; Dox nuclear localization is represented in green by means of the drug auto-fluorescent signal, scale bar: 5 µm. Right panel: evaluation of Dox nuclear fluorescence by arbitrary units (A.U.) in Dox-exposed mNVCM (Dox: 689.67 ± 37.19) versus mNVCM primed with either hAFS-CM (hAFS-CM + Dox: 99.33 ± 36.22; **** p < 0.0001) or hMSC-CM (hMSC-CM + Dox: 345.33 ± 31.15; ** p = 0.0011). Values are expressed as the mean ± s.e.m. of n = 3 independent experiments. hAFS-CM + Dox vs hMSC-CM + Dox ** p = 0.0060. (C) Left panel: representative brightfield microscopy images and immunocytochemistry analysis of the cleaved-caspase 3 enzyme (CC-3) on untreated mNVCM (Ctrl) and on mNVCM exposed for 21 h to 1 µM Dox with or without (Dox) previous priming with hAFS-CM (hAFS-CM + Dox) or hMSC-CM (hMSC-CM + Dox) for 3 h, scale bar: 20 μm. Left panel: percentage of mNVCM expressing cleaved-caspase-3 (%CC-3+ cells) in control condition (n = 11, Ctrl: 10.35 ± 0.80%), after either hAFS-CM (n = 5, hAFS-CM: 9.24 ± 0.84%) or hMSC-CM (n = 5, hMSC-CM: 10.01 ± 0.76%) stimulation alone or after exposure to Dox with or without (n = 11, Dox: 41.43 ± 2.50%) pre-incubation with hAFS-CM (n = 11, hAFS-CM+Dox: 25.67 ± 1.83%) or hMSC-CM (n = 11, hMSC-CM + Dox: 25.16 ± 1.72%). Values are expressed as the mean ± SEM of the independent experiments; hAFS-CM vs. Ctrl and hMSC-CM vs. Ctrl: not significant; Ctrl vs. Dox; #### p < 0.0001; hAFS-CM + Dox vs Dox and hMSC-CM + Dox vs. Dox **** p < 0.0001.

