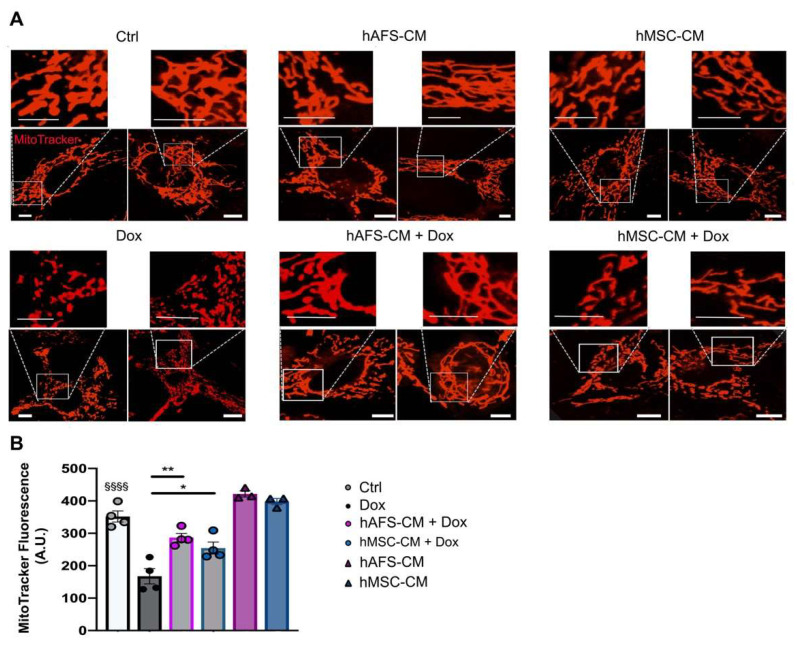
Figure 2.
hAFS and hMSC secretomes preserve mitochondrial transmembrane potential in mNVCM exposed to Dox. (A) Representative confocal images of live mNVCM in control condition (Ctrl), undergoing stimulation with either hAFS-CM (hAFS-CM) or hMSC-CM (hMSC-CM) for 3 h or exposed to 1 µM Dox for 16 h with or without (Dox) prior priming with hAFS-CM (hAFS-CM + Dox) or hMSC-CM (hMSC-CM + Dox) for 3 h. The cell mitochondrial network is represented in red by the MitoTracker signal, scale bar: 5 µm, (B) Mitochondrial transmembrane potential evaluated by MitoTracker fluorescence analysis and expressed by arbitrary units (A.U.) mNVCM treated as follows: control condition (n = 4, Ctrl: 351.85 ± 17.13); after exposure to 1 μM Dox for 16 h (n = 4, Dox: 167.52 ± 23.49); pretreated with hAFS-CM or hMSC-CM for 3 h before 1 μM Dox stimulation for 16 h (n = 4, hAFS-CM + Dox: 286.77 ± 12.94, and hMSC-CM + Dox: 254.57 ± 18.56, respectively), or only pretreated with hAFS-CM or hMSC-CM (n = 3, hAFS-CM: 421.63 ± 9.55 and hMSC-CM: 397.93 ± 9.57, respectively). Values are expressed as the mean ± SEM of the independent experiments. hAFS-CM vs. Ctrl and hMSC-CM vs. Ctrl: not significant; Ctrl vs. Dox; §§§§ p < 0.0001; hAFS-CM + Dox vs. Dox ** p = 0.0012; hMSC-CM +Dox vs. Dox * p = 0.0185.

