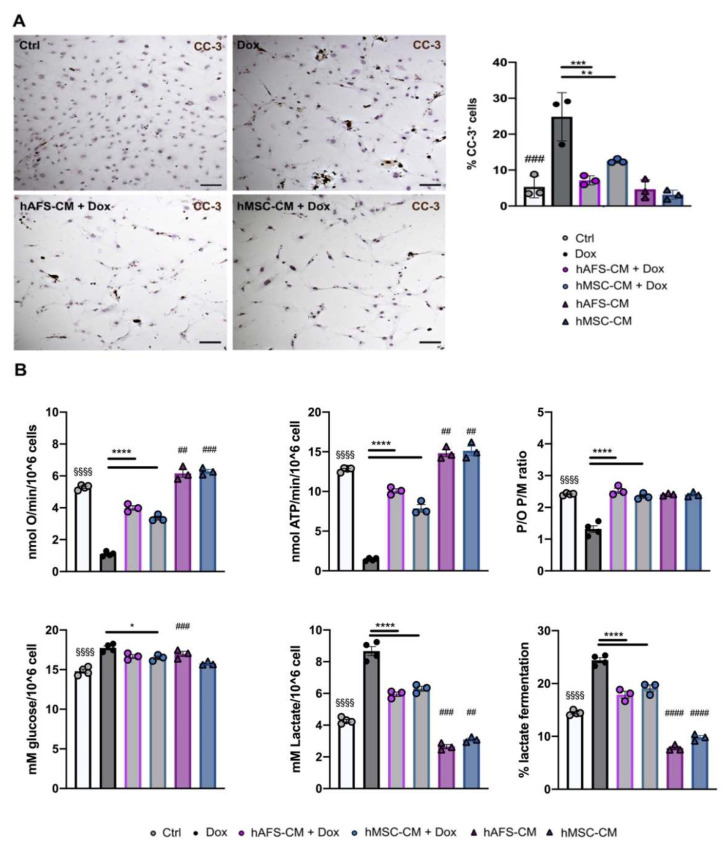
Figure 4.
hAFS and hMSC secretomes induce pro-survival effects on mNVFib exposed to 1 μM Dox and sustain their mitochondrial metabolism. (A) Left panel: representative images of immunocytochemistry analysis for the expression of cleaved-caspase 3 enzyme (CC-3) on untreated mNVFib (Ctrl) and on mNVFib exposed for 21 h to 1 μM Dox with or without (Dox) previous priming with hAFS-CM (hAFS-CM + Dox) or hMSC-CM (hMSC-CM + Dox) for 3 h, scale bar: 20 µm. Right panel: percentage of mNVFib expressing cleaved-caspase-3 (%CC-3+ cells) in control condition (Ctrl: 5.31 ± 1.75%), after either hAFS-CM (hAFS-CM: 4.65 ± 1.54%) or hMSC-CM (hMSC-CM: 3.14 ± 0.74%) stimulation alone or after exposure to 1 μM Dox with or without (Dox: 24.83 ± 3.88%) pre-incubation with hAFS-CM (hAFS-CM+Dox: 7.15 ± 0.72%) or hMSC-CM (hMSC-CM + Dox: 12.52 ± 0.33%). Values are expressed as the mean ± SEM of n = 3 independent experiments; hAFS-CM vs. Ctrl and hMSC-CM. Ctrl: not significant; Ctrl vs. Dox: ### p = 0.0001; hAFS-CM + Dox vs. Dox: *** p = 0.0003 and hMSC-CM + Dox vs. Dox: ** p = 0.0064. (B) From the top left corner: Oxygen consumption rate stimulated with pyruvate plus malate; ATP production by Fo-F1 ATP synthase stimulated with pyruvate plus malate; mNVCM P/O ratio (marker of OxPhos efficiency) after pyruvate plus malate stimulation; glucose consumption; lactate release; lactate fermentation percentage. All the biochemical measurements were performed in mNVFib treated as follows: control condition (Ctrl), after exposure to 1 μM Dox (Dox), pretreated with hAFS-CM or hMSC-CM before the Dox stimulation (hAFS-CM + Dox and hMSC-CM + Dox, respectively), or only pretreated with hAFS-CM or hMSC-CM (hAFS-CM and hMSC-CM, respectively). In each panel, values are expressed as the mean ± SEM of the independent experiments; hAFS-CM vs. Ctrl ## p < 0.01 (p = 0.0035 for oxygen consumption rate and p = 0.0015 for ATP production), ### p < 0.001 (p = 0.0002 glucose consumption and for lactate release) and #### p < 0.0001; hMSC-CM vs. Ctrl ## p < 0.01 (p = 0.0018 for ATP production and p = 0.0032 for lactate release) ### p < 0.001 (p = 0.0010 for oxygen consumption rate) and #### p < 0.0001; Ctrl vs. Dox §§§§ p < 0.0001; hAFS-CM + Dox vs. Dox and hMSC-CM + Dox vs. Dox **** p < 0.0001 and * p = 0.0247.

