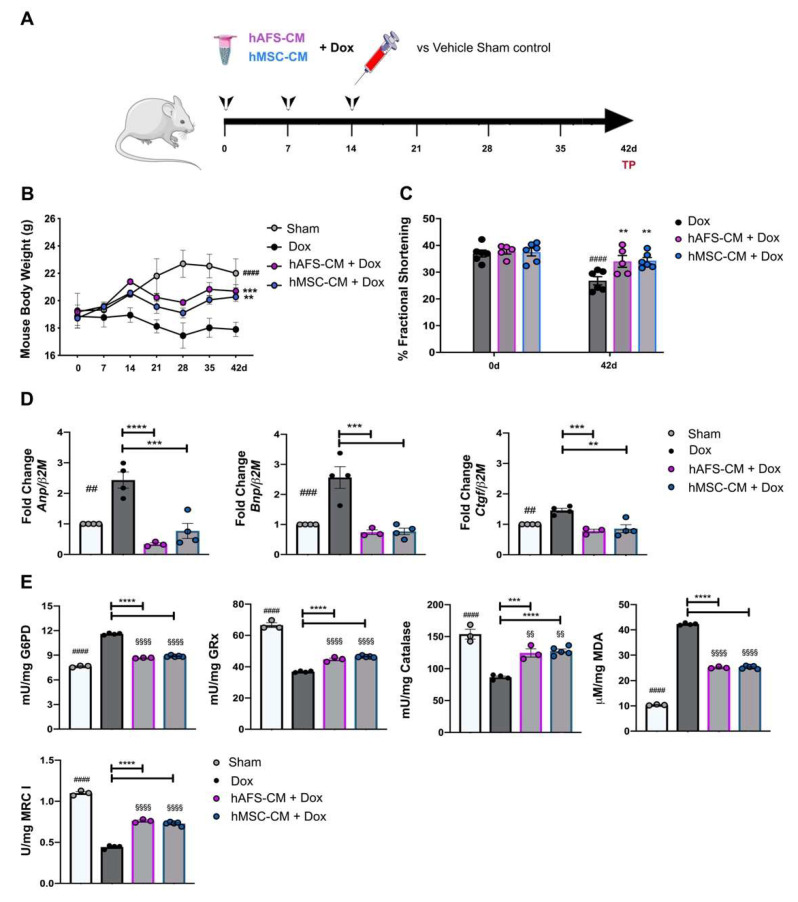
Figure 5.
hAFS and hMSC secretomes exert long-term cardioprotective effects in a preclinical mouse model of Dox-induced cardiomyopathy. (A) Schematic of the experimental design for in vivo experiments; a cumulative 12 mg/Kg Dox dose was administered by intra-peritoneal delivery three times, once a week, over 14 days (4 mg/kg on days 0-7-14). The hAFS-CM and hMSC-CM (100 μg/mouse) were administered 3 h before each 4 mg/kg Dox injection. (B) Evaluation of mice body weight over time in sham healthy control animals (n = 3, Sham: day 0: 19.27 ± 1.27 g; day 42: 22.03 ± 1.03 g) and in mice receiving Dox with or without (n = 4, Dox: day 0: 18.85 ± 0.83 g; day 42: 17.90 ± 0.52 g) pre-incubation with hAFS-CM (n = 6, hAFS-CM + Dox: day 0: 19.16 ± 0.15 g; day 42: 20.70 ± 0.47 g) or hMSC-CM (n = 5, hMSC-CM + Dox: day 0: 18.72 ± 0.53 g; day 42: 20.28 ± 0.33 g). Values are expressed as the mean ± SEM of the different animals. Sham vs. Dox at day 42: #### p < 0.0001; hAFS-CM + Dox vs. Dox at day 42: *** p = 0.0008 and hMSC-CM +Dox vs. Dox at day 42: ** p = 0.0083. (C) Ultrasound analysis of cardiac function via evaluation of fractional shortening percentage over time in mice receiving a cumulative dose of 12 mg/Kg Dox with or without (n = 6, Dox: day 0: 37.0 ± 1.30% vs. day 42: 26.80 ± 1.30%) pre-incubation with hAFS-CM (n = 5, hAFS-CM + Dox: day 0: 37.80 ± 1.02%; day 42: 34.01 ± 2.20%) or hMSC-CM (n = 6, hMSC-CM + Dox: day 0: 37.50 ± 1.44%; day 42: 34.30 ± 1.20%). Values are expressed as the mean ± SEM of the independent animals. Dox day 0 vs. day 42: #### p < 0.0001; hAFS-CM + Dox vs. Dox at day 42: ** p = 0.0055 and hMSC-CM +Dox vs. Dox at day 42: ** p = 0.0026. (D) Real time qRT-PCR analysis on murine myocardial tissue 42 days after starting Dox administration with or without (Dox, n = 4) pre-treatment with hAFS-CM (hAFS-CM + Dox, n = 3) or hMSC-CM (hMSC-CM+ Dox, n = 5) versus sham healthy control mice (Sham, considered as calibrator, n = 4) for the fold-change expression of Anp (Atrial natriuretic peptide; Dox: 2.43 ± 0.22; hAFS-CM + Dox: 0.34 ± 0.03; hMSC-CM+Dox: 0.77 ± 0.21), Bnp (Brain natriuretic peptide; Dox: 2.56 ± 0.31; hAFS-CM + Dox: 0.74 ± 0.06; hMSC-CM + Dox: 0.77 ± 0.09), Ctgf (Connective tissue growth factor; Dox: 2.56 ± 0.31; hAFS-CM + Dox: 0.74 ± 0.06; hMSC-CM + Dox: 0.77 ± 0.09) over the β2M (Beta-2 Microglobulin) housekeeping gene. In each panel, values are expressed as the mean ± SEM of the independent experiments. Sham vs. Dox: ## p = 0.0011 (Anp), ### p = 0.0008 (Bnp) and ## p = 0.0084 (Ctgf); hAFS-CM + Dox vs. Dox: **** p < 0.0001 (Anp), *** p = 0.0004 (Bnp), *** p = 0.0008 (Ctgf); hMSC-CM + Dox vs Dox: *** p = 0.0003 (Anp), *** p = 0.0002 (Bnp) and ** p = 0.0012 (Ctgf). (E) From the top left corner: glucose-6-phosphate dehydrogenase (G6PD) activity; glutathione reductase (GRx) activity; catalase (CAT) activity; malondialdheyde (MDA) intracellular concentration; Complex I (MRC I) activity. All the biochemical measurements have been performed at 42 days from initial treatment in the hearts of: sham healthy control mice (Sham, n = 3), mice receiving a cumulative dose of 12 mg/Kg Dox (Dox, n = 4) with or without pre-administration of hAFS-CM (hAFS-CM + Dox, n = 3) or hMSC-CM (hMSC-CM + Dox, n = 5). In each panel, values are expressed as the mean ± SEM of the independent experiments and reported in Table S2; Sham vs. Dox: #### p < 0.0001; Sham vs. hAFS-CM: §§§§ p < 0.0001 and §§ p = 0.0067 (CAT); Sham vs. hMSC-CM: §§§§ p < 0.0001 and §§ p = 0.0065 (CAT); hAFS-CM + Dox vs. Dox: ***** p < 0.0001 and *** p = 0.0006 (CAT); hMSC-CM + Dox vs. Dox: ***** p < 0.0001.

