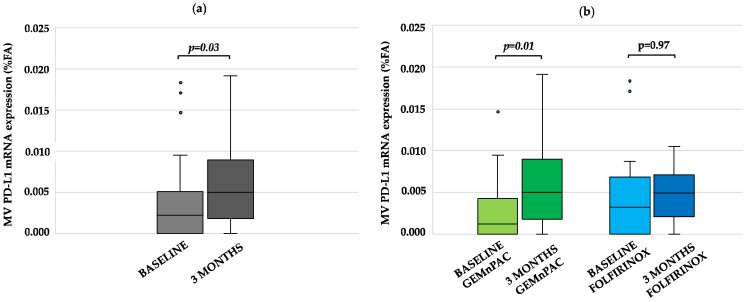
Figure 1.
Effect of chemotherapy on PD-L1 mRNA levels in pancreatic cancer. (a) PD-L1 mRNA expression evaluated at baseline (light grey) and at tumor re-assessment after 3 months of treatment (dark grey), in the overall population; (b) differences in PD-L1 mRNA expression between baseline (light green and blue) vs. 3 months (dark green and blue) in patients grouped according to chemotherapy regimen (GEMnPAC vs. FOLFIRINOX). p values are reported on top of the bar chart. Abbreviations: PD-L1, programmed death-ligand 1; FA, fractional abundance.

