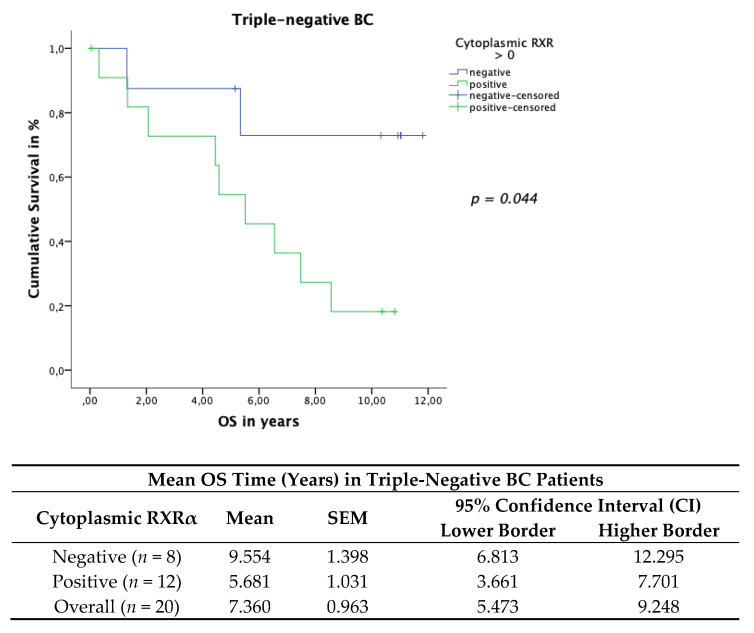
Figure 9.
Kaplan–Meier survival analysis assessing cytoplasmic RXRα positive expression in the triple-negative patient cohort in relation to OS. Statistical significance is shown as p-values determined using the log-rank test (p < 0.05). The risk table demonstrates the mean survival time in triple-negative patients, SEM and the 95% confidence interval (CI) for univariate analyses.

