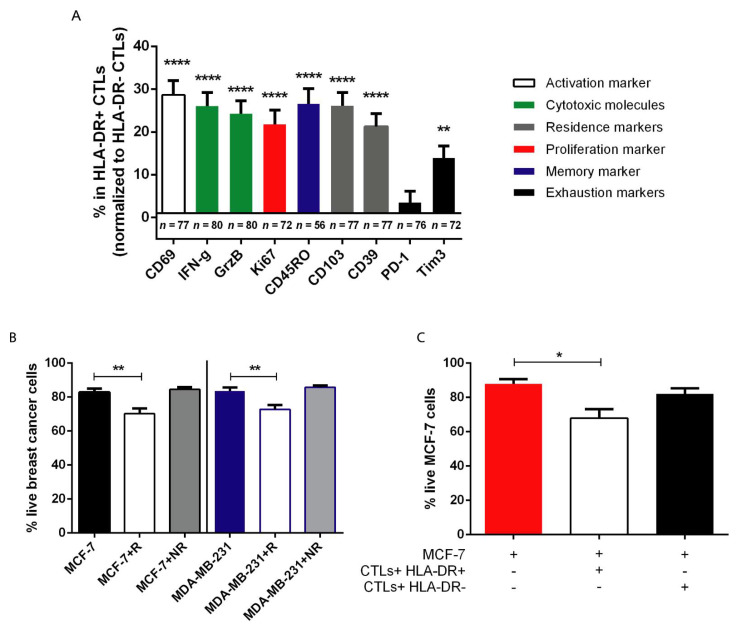
Figure 4.
HLA-DR+ CTLs have enhanced anti-tumor properties in comparison to HLA-DRnegative CTLs. (A) Percentage of the activation marker CD69, the cytotoxic molecules IFN-γ and Granzyme B (GrzB), the proliferation marker Ki67, the memory marker CD45RO, the tissue-resident markers CD103 and CD39, and the exhaustion markers PD-1 and Tim3 within the tumor infiltrating population of HLA-DR+ CTLs, normalized to the percentage of these markers within the tumor infiltrating population of HLA-DRnegative CTLs (number of biopsies used for this characterization is described in the graph). (B) Percentage of live MCF-7 cells in monoculture (MCF-7, black bar, n = 10), in co-culture with NACT-responders’ PBMCs (MCF-7+R, white bar, n = 10), and with NACT non-responders’ PBMCs (MCF-7+NR, grey bar, n = 11); percentage of live MDA-MB-231 cells in monoculture (MDA-MB-231, blue bar, n = 11), in co-culture with NACT-responders’ PBMCs (MDA-MB-231+R, white bar, n = 10), and with NACT non-responders’ PBMCs (MDA-MB-231+NR, grey bar, n = 12). (C) Viability of MCF-7 cells either in monoculture (red bar, n = 5) or in co-culture with sorted HLA-DR+ CTLs (white bar, n = 8) and HLA-DRnegative CTLs (black bar, n = 8). Data are represented as mean ± SEM, *p < 0.05, **p < 0.01, ****p < 0.0001.

