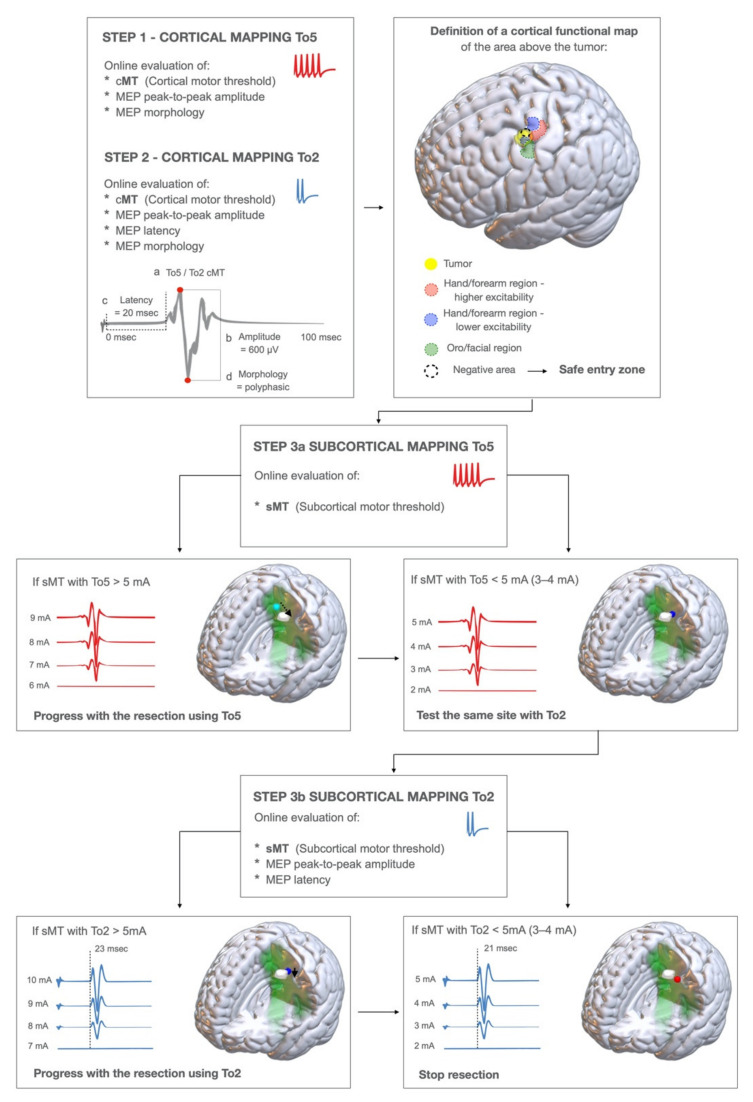
Figure 1.
Steps of the brain mapping technique to detect the two functional components of M1. STEP1: a cortical mapping with HF-To5 paradigm is performed to explore the cortical area of interest. At each site (a) the cortical motor threshold (cMT), (b) the MEP peak-to peak amplitude, and (d) the MEP morphology are evaluated. See Figure S1 for practical insights on how to evaluate the peak-to-peak amplitude and MEP morphology. The Cortical Motor Threshold is defined as the lowest current intensity which is evoking the lowest MEP response. STEP2: the same sites are explored again with HF-To2, evaluating at each site: (a) the cMT, (b) the MEP peak-to-peak amplitude, (c) the MEP latency (evaluated from the first pulse artifact), (d) the MEP morphology. By performing this, we defined the cortical functional map, identifying: 1. The area of higher excitability, 2. The area of lower excitability, 3. The safe entry zone: the area where no MEPs are evoked (at current intensity > 20 mA, at HF-To2) or the area of lower excitability (see text). STEP3a: subcortical motor mapping initially performed with HF-To5. A continuous motor mapping is performed by placing the monopolar probe in the close vicinity of the resection site (suction) and coupled with it. At each site, the subcortical-MT (sMT) is continuously evaluated. If the sMT is > 5 mA, the resection is continued until sMT < 5 mA; in this case, the same site is explored by HF-To2 STEP3b: subcortical motor mapping with HF-To2; at each resection site, we evaluated (a) the sMT, (b) the MEP peak-to-peak amplitude, (c) MEP latency, (d) the MEP morphology. If the sMT > 5 mA, the resection is continued until the sMT is < 5 mA, and when sMT is 2–3 mA the resection is stopped.

