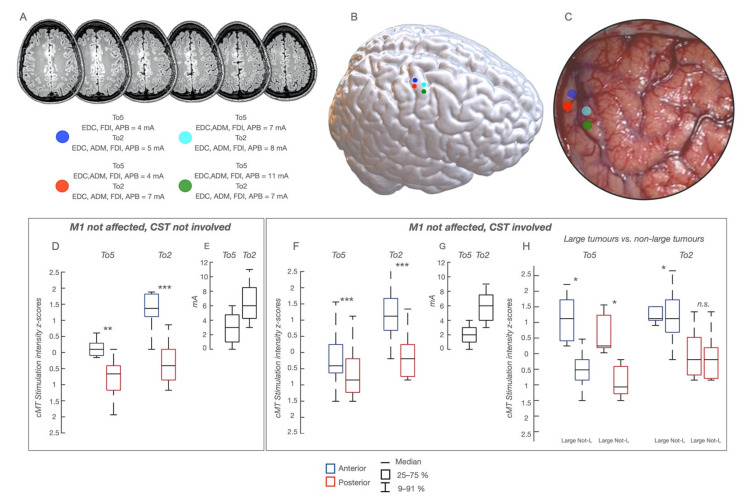
Figure 2.
Functional Map in patients with M1 intact and CST not involved or involved at variable extent, whose cortical functional map is presented in a representative patient with a glioma involving the non-dominant hemisphere; the lesion is visible in (A), sequential axial FLAIR images and a poorly defined mass (low-grade) involving the pre-SMA region. The sites of HF-To5 and HF-To2 stimulation in the hand-knob region are visible as colored dots superimposed to the NMI space (B) and to the intraoperative field picture (C). For each dot, the cMT (quantitative parameter) at HF-To5 and HF-To2 and the pattern of muscle activated (qualitative parameters) are reported. (D) Comparison of cMT obtained with HF-To5 and HF-To2 for the stimulation of the anterior and posterior region of the hand-knob area in the 9 patients with M1 and CST not involved; cMT are expressed as 25–75% median (rectangle) and 9–91% (edge of the box), along with the delta (E); * p < 0.5; ** p < 0.01; *** p < 0.001. (F) Comparison of cMT obtained with HF-To5 and HF-To2 stimulation of the anterior and posterior region of the hand-knob area, in the 28 patients with M1 intact and the CST involved; cMT are expressed as 25–75% median (rectangle) and 9–91% (edge of the box), along with the delta (G); * p < 0.5; ** p < 0.01; *** p < 0.001. (H) Comparison of cMT at the anterior and posterior borders of the hand-knob area in the 5 patients of the previous group harboring a large tumor and in the remaining 23 patients. The cMT are higher in the first sub-group of patients (large tumors) with HF-To5 but not with HF-To2.

