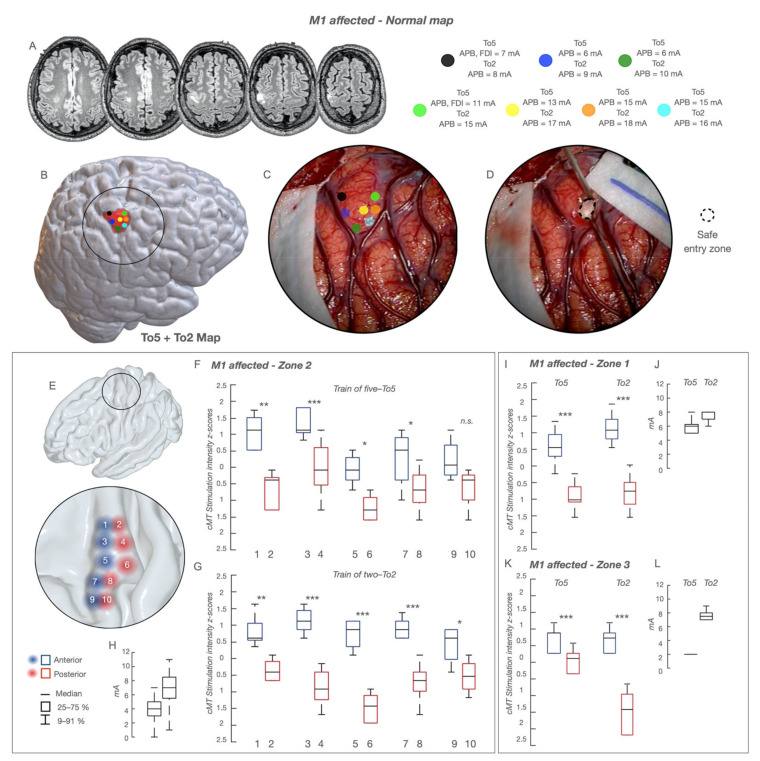
Figure 3.
“Normal” functional cortical map in the group of 66 patients with tumors within M1. The functional cortical map is presented in a representative case of glioma involving the non-dominant hand-knob; the lesion is visible in (A), sequential axial FLAIR images, as a poorly defined mass (low-grade glioma) involving the hand-knob region of M1. The cortical area exposed (circle line), the sites stimulated with HF-To5 and HF-To2 (colored dots) and the tumor area (pink volume) are reconstructed in an NMI space and shown in (B). The picture of the intraoperative field along with the location of the stimulated sites (colored dots) superimposed to the surgical field is shown in (C). The entry point where the resection was started is shown in (D) as a dotted circle. For each dot, the cMT (quantitative parameter) at HF-To5 and HF-To2 and the pattern of muscle activated (qualitative parameters) are reported; when the same sites were stimulated with HF-To2, only APB MEPs were evoked at the anterior bank (cMT 15–17 mA) and at the posterior one (cMT 8–10 mA). A clear functional segregation was documented between the anterior (lower excitability) and posterior (higher excitability) regions. The safe entry zone (D) corresponded to the area of lower excitability. (E) The hand-knob region was divided based on 10 stimulated sites (1,3,5,7,9 covering the anterior region—red circles; 2,4,6,8,10 covering the posterior region—blue circles); in each site the cMT (absolute value, mA) at HF-To5 (F) and HF-To2 (G) was normalized within the subject (Z-score) to allow for a comparison between the anterior and posterior regions with each paradigm. The same procedure was applied for the other body division, lower limb (zone-1) (I) and face (zone-3) (K). cMT are expressed as 25–75% median (rectangle) and 9–91% (edge of the box), along with the delta (H,J,L); * p < 0.5; ** p < 0.01; *** p < 0.001.

