Figure 4.
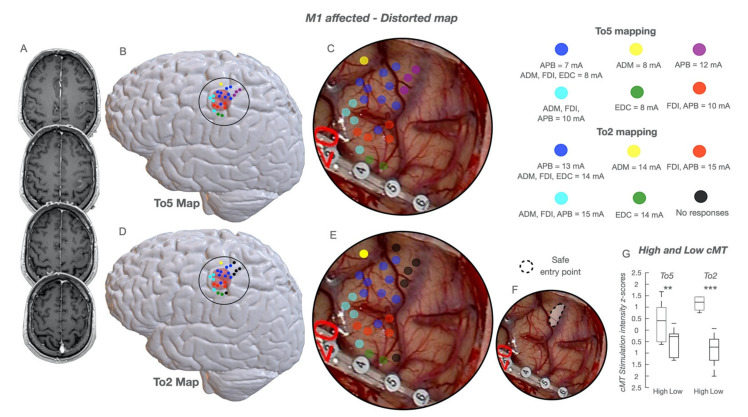
Distorted functional map in patients with M1 involved. The functional cortical map is presented in a case of glioma involving the hand-knob region in the dominant hemisphere; the lesion is visible in (A), sequential axial post GD T1 weighted images, as a well-defined patchy enhancing mass involving the hand-knob region of M1. The cortical area exposed (circle line), the sites stimulated with HF-To5 (colored dots) and the tumor area (pink volume) are reconstructed in an NMI space and shown in (B) (To5 Map). The cortical area exposed (circle line), the sites stimulated with HF-To2 (colored dots) and the tumor area are reconstructed in an NMI space and shown in (D) (To2 Map). The picture of the intraoperative field along with the location of the stimulated sites (colored dots) by using HF-To5 superimposed to the surgical field is shown in (C); a cortical strip is crossing the inferior part of the motor cortex (at the inferior border of the hand-knob region); HF-To5 evoked MEPs at variable cMT (ranging between 7 and 12 mA) without a functional segregation between the anterior and posterior regions. The picture of the intraoperative field along with the location of the stimulated sites (colored dots) by using HF-To2 superimposed to the surgical field is shown in (E); HF-To2 evoked MEPs at variable cMT (ranging between 13 and 15 mA) without a functional segregation between the anterior and posterior regions; however, a region in which no MEPs were evoked at a current intensity of 20 mA was detected in the superior and posterior regions of the motor cortex (no response, black dots); this region was used as a safe entry zone in which to perform the corticectomy and to start the resection (shown in (F) as a dotted circle line, safe entry point). In “distorted-map” patients, in the absence of an anterior and posterior subdivision, the highest and lowest cMT in each patient obtained with HF-To5 vs. HF-To2 were selected (G); the values were then normalized within the subject (Z-score) to assess the preservation, despite the subversion of the architecture, of the two different functional components. Cumulative cMT are expressed as 25–75% median (rectangle) and 9–91% (edge of the box); ** p < 0.01; *** p < 0.001.

