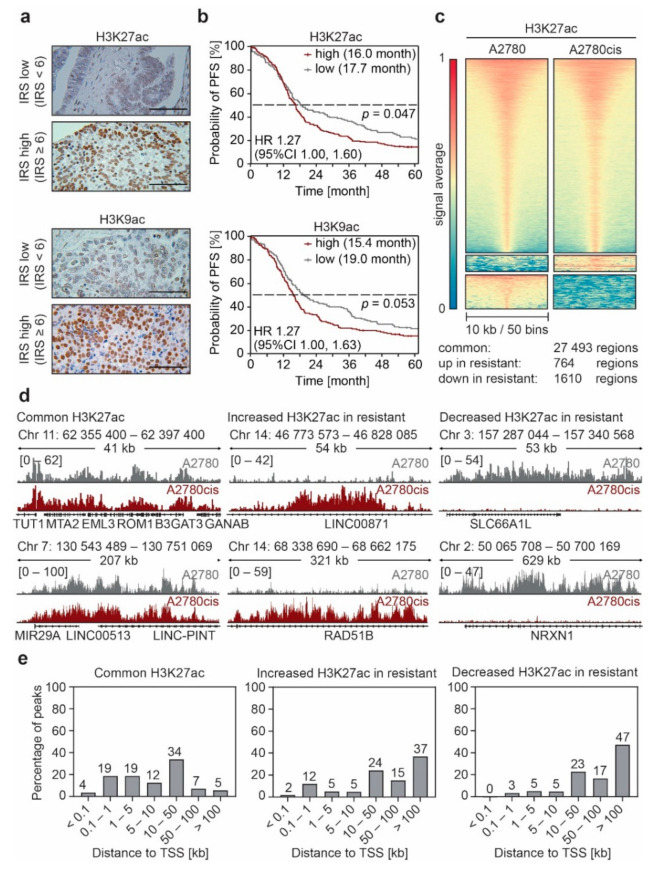
Figure 1.
Non-genetic resistance to platinum (cPt) in epithelial ovarian cancer (EOC) is associated with changes in the enhancer landscape. (a) Representative immunohistochemistry (IHC) images of EOC patient tissue stained against H3K27ac or H3K9ac evaluated by the immune reactive score (IRS) to attribute staining intensity of the specimens for the Kaplan–Meier survival analysis as shown in B. Tissue samples with low (IRS < 6) or high (IRS ≥ 6) modification levels are shown (scale bar 100 μm). (b) Kaplan–Meier survival analysis of progression-free survival (PFS) of 365 patients with high-grade serous EOC with low or high H3K27ac or H3K9ac modification levels. Median survival of each group is indicated. Statistical significance was determined by Chi-Square statistics of the Log-Rank test (Mantel–Cox). (c) Heatmaps showing the average H3K27ac ChIP-seq signal for A2780 and A2780cis EOC cells. Signals are sorted by the highest average signal in A2780 cells and plotted with a 10 kb window around the peak center. Regions with differential H3K27ac signal between sensitive and resistant cells were identified by K-means clustering. (d) Representative ChIP-seq tracks of H3K27ac intensity in A2780 and A2780cis cells for regions with common and differential H3K27ac peaks identified in (c). (e) Distribution of the distance of the common and differential H3K27ac peaks from (c) to the nearest transcription start site (TSS) identified by ChIP-Enrich.

