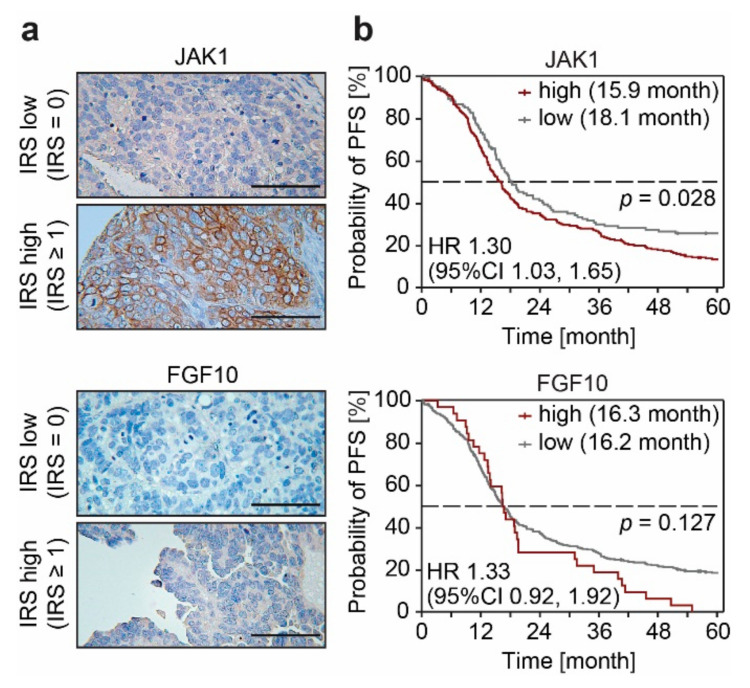
Figure 4.
FGF10 and JAK1 can serve as independent predictive biomarkers. (a) Representative IHC images of EOC patient tissue stained for JAK1 or FGF10. IRS was used to attribute specimen according to their protein expression level for the Kaplan–Meier survival analysis shown in (b). Tissue samples with low (IRS = 0) or high (IRS ≥ 1) protein expression levels are shown (scale bar = 100 μm). (b) Kaplan–Meier survival analysis of progression-free survival (PFS) of 365 patients with high-grade serous EOC with low or high JAK1 or FGF10 expression level. Median survival of each group is indicated. Statistical significance was determined by Chi-Square statistics of the Log-Rank test (Mantel–Cox).

