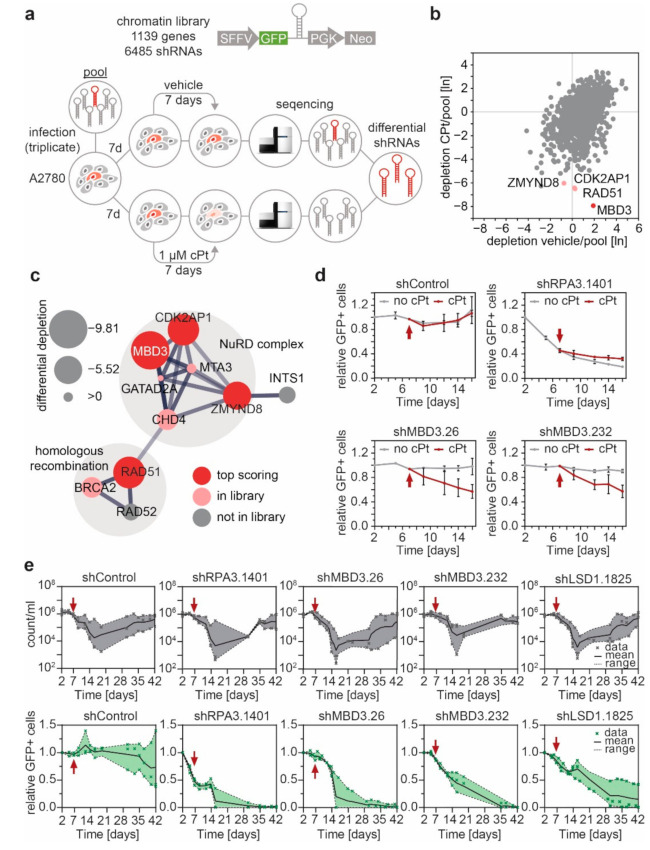
Figure 5.
A multiplexed RNAi screen identifies MBD3 as a sensitizer to cPt treatment and suppressor of cPt resistance acquisition in A2780 EOC cells. (a) Schematic representation of the multiplexed RNAi screening strategy using the indicated chromatin-focused shRNA library. (b) Scatter plot showing the relative depletion (day 14/pool) of all genes in the library under cPt treatment compared to the vehicle control. The top-four depleted genes are highlighted. Geometric mean, n = 3. (c) String network analysis of the top four differential hits. Node radius indicates level of differential depletion. Red node color indicates a differential top hit, and light red indicates genes present in the library. Edges between nodes indicate both functional and physical protein associations, line thickness indicates the strength of the underlying data. (d) Competitive proliferation assays of A2780 EOC cells expressing the indicated shRNAs. Shown is the relative fraction of GFP+/shRNA+ cells relative to the initial measurement. After 7 days, cells were treated with vehicle or cPt (1 µM), as indicated by the red arrow, and analyzed for additional 9 days. Mean ± SEM, n = 3. (e) Competitive proliferation assays of A2780 EOC cells expressing the indicated shRNAs to determine the long-term effects of suppression of MBD3 or LSD1 expression under cPt treatment. A2780 cells expressing the indicated shRNAs were analyzed for the absolute cell number (count/mL) and the fraction of GFP+/shRNA+ cells relative to the initial measurement. Treatment with cPt (1 µM) was started, as indicated by the red arrow. Mean with range (shaded area) and individual data points are shown, n = 3.

