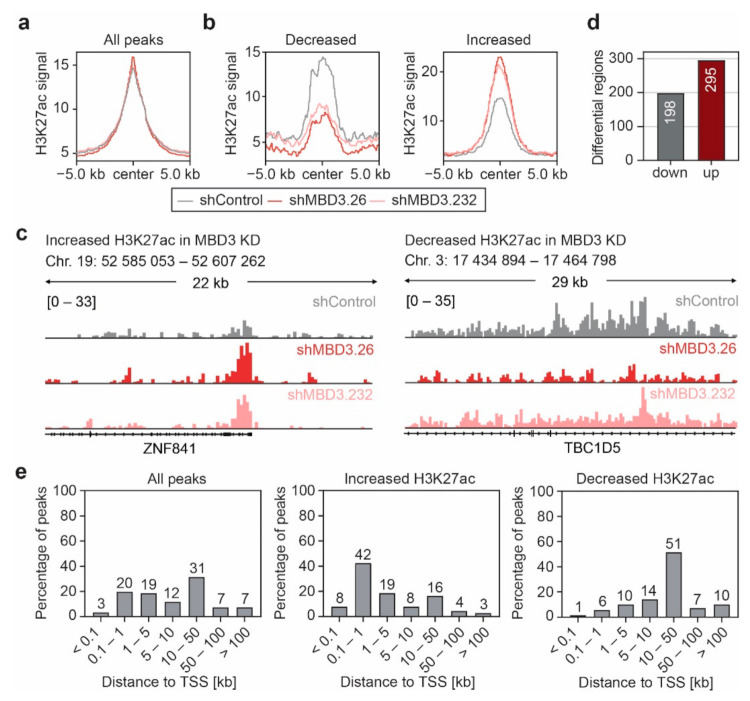
Figure 6.
Suppression of MBD3 is associated with alterations of H3K27ac within selected regulatory regions. (a,b) Profile plot of the average H3K27ac ChIP-seq signal in A2780 cells expressing control or MBD3 shRNAs for all H3K27ac peaks (a) or regions that show an increase or decrease of H3K27ac upon MBD3 suppression (b). Regions with differential H3K27ac ChIP-seq signal were identified by differential peak filtering. Average H3K27ac signals are plotted with a 10 kb window around the peak center. (c) Representative ChIP-seq tracks of H3K27ac intensity for regions with increased or decreased H3K27ac signal in MBD3 KD A2780 cells from (b). (d) Number of genomic regions associated with increased or decreased H3K27ac signal upon MBD3 suppression in A2780 cells. (e) Distribution of the H3K27ac peak distance to the nearest TSS identified by ChIP-Enrich.

