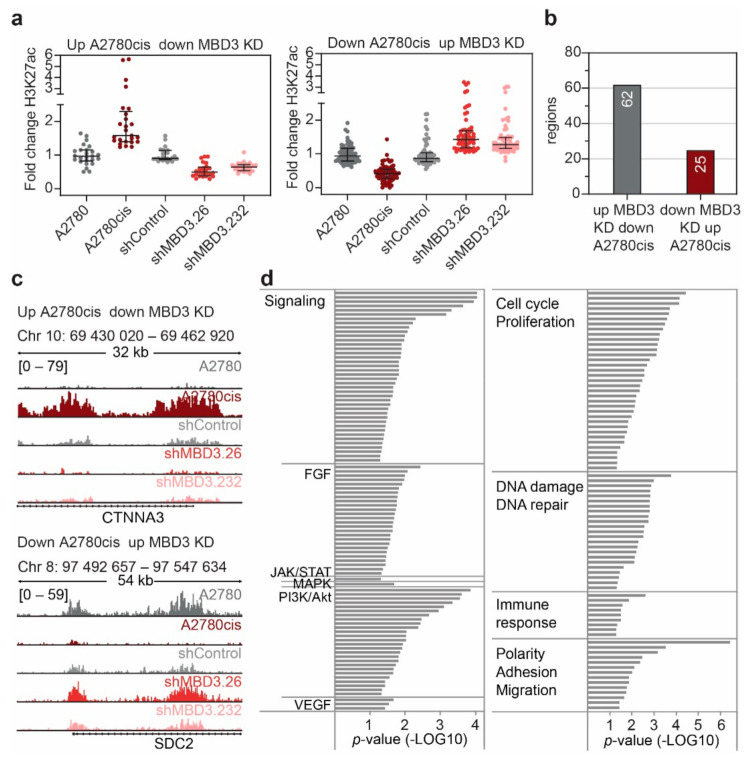
Figure 7.
MBD3 suppression modulates H3K27ac in differential regions associated with resistance. (a) Scatter plot showing the fold change in H3K27ac signal of all regions with inverse change in H3K27ac signal between MBD3 suppression and cPt-resistant A2780cis cells. Fold change is shown for regions with increased acetylation in resistant cells and decreased acetylation in sensitive A2780 cells (left) and regions which display decreased H3K27ac in resistant cells and increased H3K27ac in sensitive A2780 cells (right). Respective shRNAs are indicated. Median and interquartile range are shown. (b) Number of genomic regions associated with the differentially regulated regions identified in (a). (c) Representative ChIP-seq tracks of H3K27ac signal in A2780 and A2780cis cells and A2780 cells expressing the indicated shRNAs. (d) Gene-set-enrichment analysis (ChIP-Enrich) for all genes associated to the differentially regulated regions identified in (a). All identified pathways with a p-value ≤ 0.05 were categorized as indicated.

