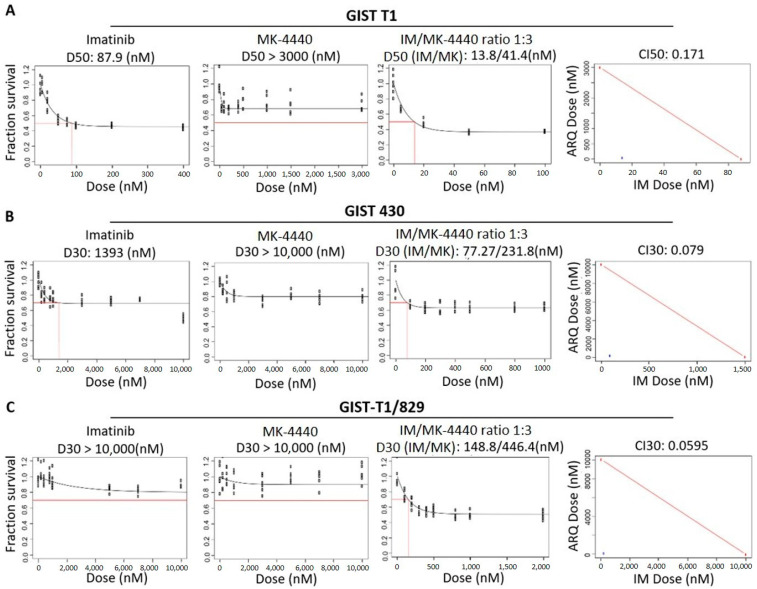
Figure 1.
MK-4440 and IM have enhanced combination on in vitro GIST cell growth. Panels 1 & 2, dose-response curves for single agents (IM, MK-4440) in GIST-T1 (A), GIST430 (B) and GIST-T1/829 (C) cell lines. Values represent the mean of survival compared to control cells (n = 6). Panel 3, dose-response curve representing increasing series of combinations in GIST-T1 (A) GIST430 (B) and GIST-T1/829 (C) cell lines. Red box indicates estimation of LD50 (GIST-T1, (A)) or LD30 (GIST430, (B) and GIST-T1/829, (C)) concentration for combination of drugs. Panel 4, single point (blue) on isobole curve for 50% kill (GIST-T1, (A)) or 30% kill (GIST430, (B) and GIST-T1/829, (C)). Red line indicates 50% (GIST-T1) isobole or 30% isobole for GIST430 and GIST-T1/829 for strictly additive effect. CILD50 in GIST-T1 is 0.171 and CILD30 in GIST430 and GIST-T1/829 are 0.079 and 0.0595, respectively, all found within the synergistic triangle.

