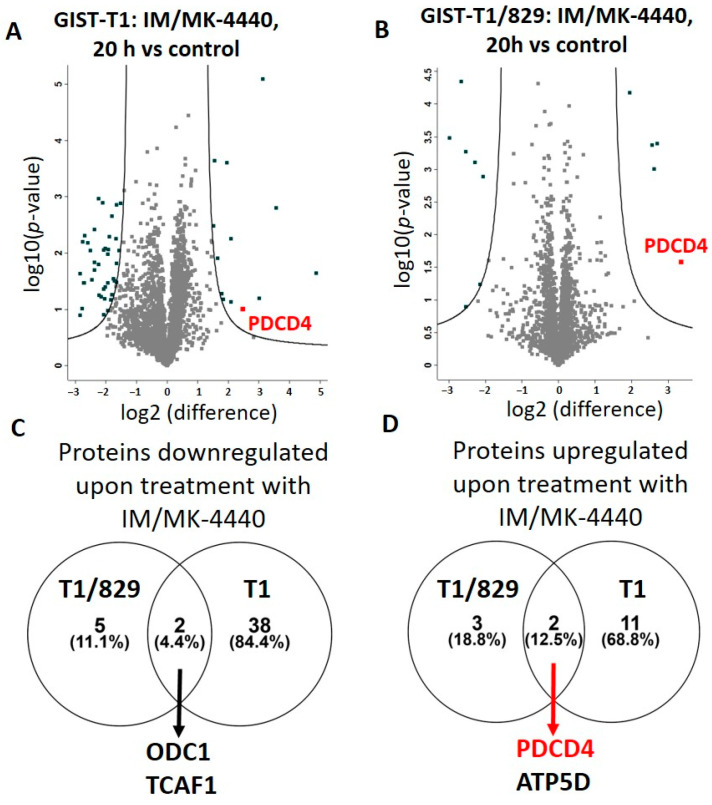
Figure 3.
Total proteome changes upon IM/MK-4440 treatment. Volcano plot comparisons of total proteome in GIST-T1 (A) and GIST-T1/829 (B) cells treated with IM/MK-4440 combination versus vehicle (control) for 20 h. Differences in log2 LFQ intensities among cell lysates from three experiments determined by paired t-test at FDR of <0.05 using Perseus software. Venn diagram comparisons of downregulated (C) and upregulated (D) proteins between GIST-T1 and GIST-T1/829.

