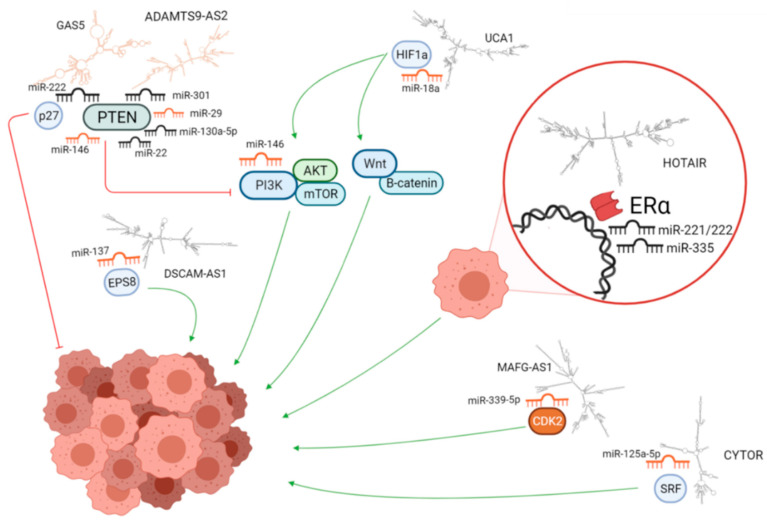
Figure 4.
miRNAs, lncRNAs, and target mRNA differentially expressed in resistant breast cancer cells lines. Upregulated miRNAs and lncRNAs are in black, while those downregulated are in orange. Structures of lncRNAs were predicted using the RNAfold tool in the ViennaRNA Package 2.0 and drawn using MFE plain structure drawing. The figure does not contain all regulatory molecules found in this study. The molecules are not to scale.

