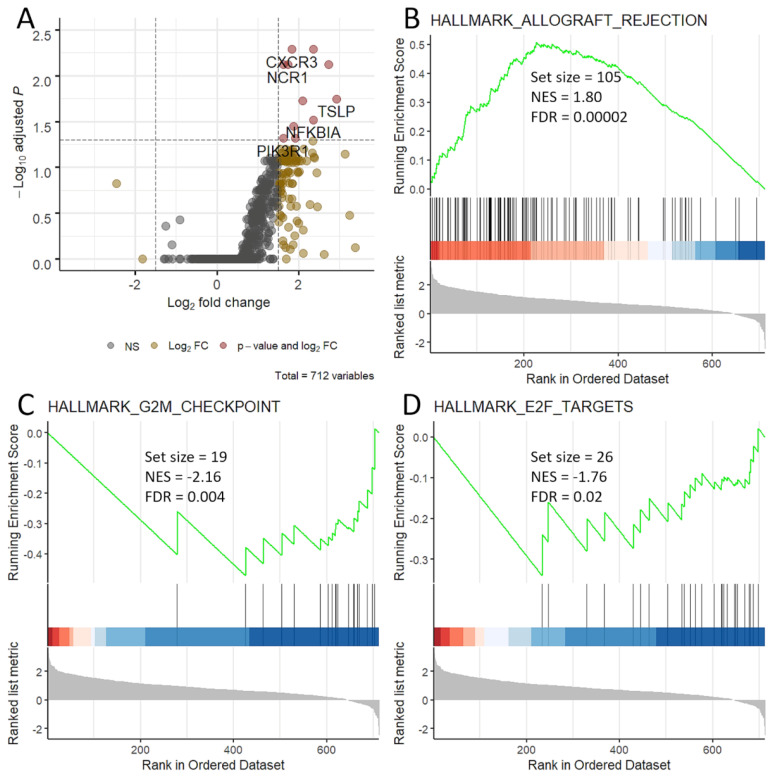
Figure 1.
Gene expression differences between patients with and without durable clinical benefit to pembrolizumab. Patients with non-durable clinical benefit were used as baseline. (A) Volcano plot. Log2 fold changes (x-axis) and −Log10 of false discovery rate (y-axis) were plotted. Red denotes genes that are significantly different. (B–D) Gene sets differentially activated based on GSEA analysis; in detail, Allograft rejection (B) is activated in patients with durable benefit, while G2M checkpoint (C) and E2F targets (D) are activated in patients who progressed early. NES, normalized enrichment score; FDR, false discovery rate.

