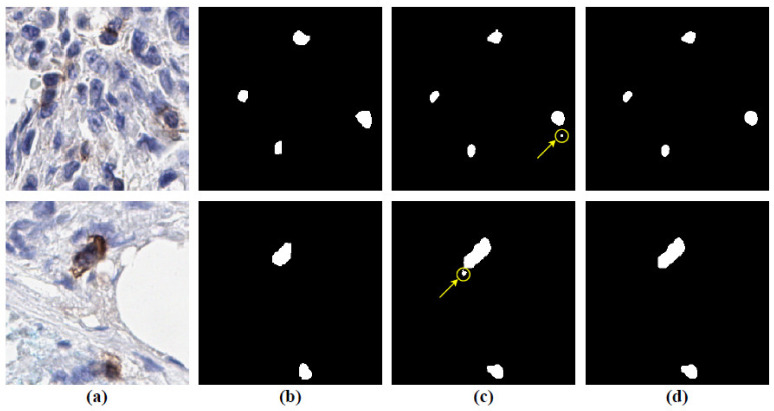
Figure 10.
Visualization of the effect of post-processing method using two segmentation examples. (a) Original test images (randomly selected from the unseen test set), (b) annotated ground-truth by pathologist (binary regions corresponding to the original images), (c) predicted images by the model before applying the post processing method; yellow arrows are indicating the false positives are detection and (d) predicted images after applying the post-processing method; the detected false positives are removed.

