Figure 2.
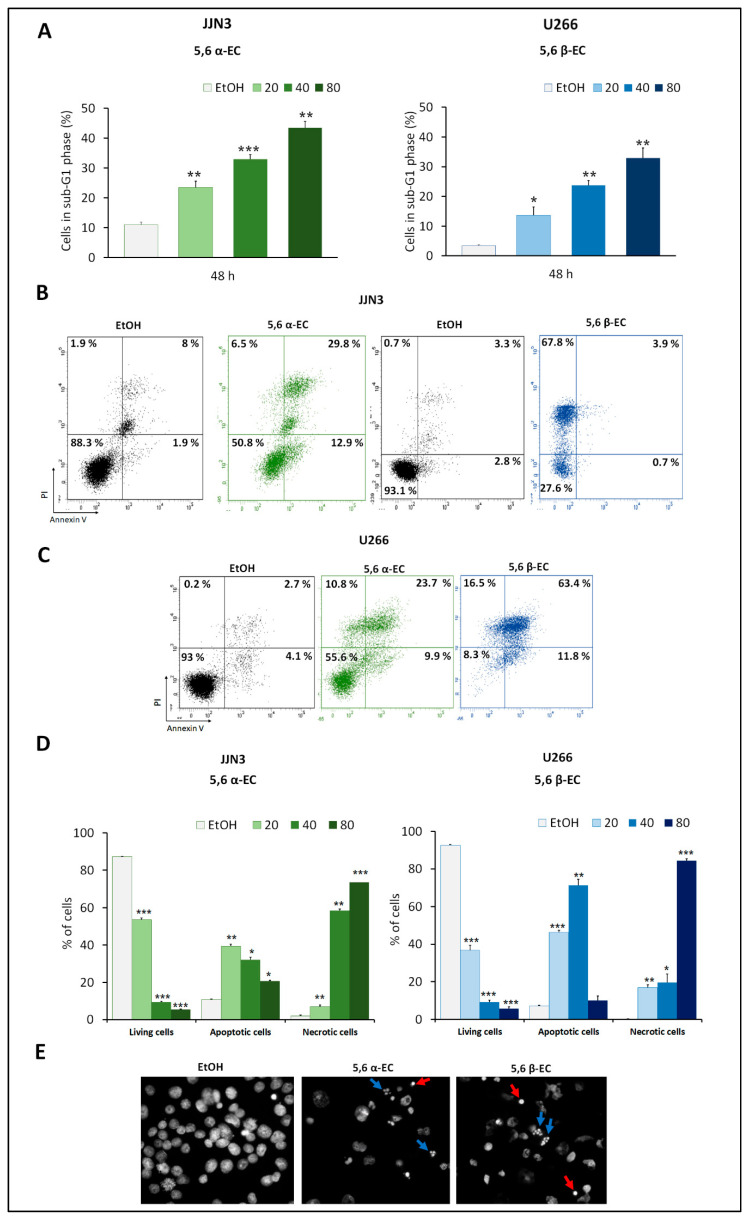
5,6-ECs induce apoptosis of HMCLs. (A) JJN3 and U266 cells were seeded at the density of 2 × 10⁵ cells/well in 24-well plates for 24 h and treated for 48 h with 20–80 μg/mL 5,6 α-EC or 5,6 β-EC. To quantify cells in the sub-G1 cell cycle phase after treatment, cells were fixed in EtOH 70% and stained with PI. DNA content was measured by flow cytometry. The histograms represent the percentages of JJN3 or U266 cells in the sub-G1 phase as means ± SD (Table S3). (B,C) To investigate 5,6ECs-induced apoptosis, cells were harvested and stained with annexin V/PI. Data were acquired by flow cytometry. Living cells (annexin V–/PI–), apoptotic cells (annexin V+/PI– and annexin V+/PI+) and necrotic cells (annexin V–/PI+) were recorded. Cytometry profiles are presented for JJN3 cells treated with 20 µg/mL 5,6-ECs (B) and U266 cells treated with 40 µg/mL 5,6-ECs. (D) The percentages of each population as means ± SD are reported in the histograms for JJN3 and U266 cells. * p < 0.05; ** p < 0.01; *** p < 0.001 with the t-test (Tables S4 and S5). No statistically significant difference between control and vehicle was noticed. (E) U266 cells were treated for 24 h with 40 μg/mL 5,6 α-EC or 5,6 β-EC. After fixation in 2% PFA, cells were cytospun on slide glasses. Nuclei were stained by Hoechst 33,342 and visualized by fluorescence microscopy. Red arrows indicate cells with condensed chromatin; blue arrows cells with fragmented nuclei (×400, magnification).

