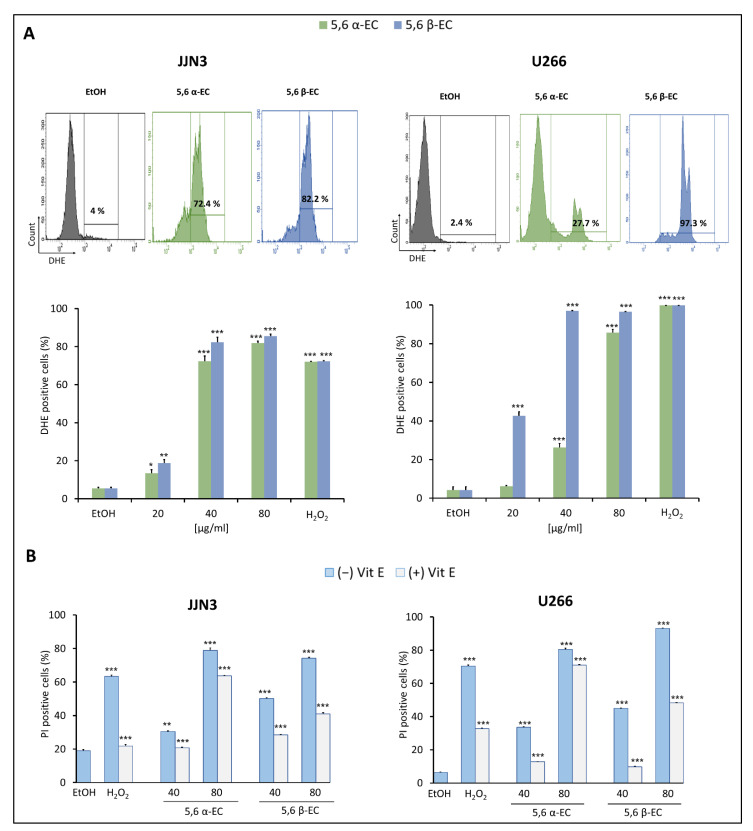
Figure 4.
ROS overproduction induced cell death of 5,6 ECs-treated HMCLs. (A) JJN3 and U266 cells were cultured in 24-well plates (2 × 10⁵ cells/well) for 24 h. Then, cells were treated with 20–80 μg/mL of 5,6 α-EC or 5,6 β-EC for 24 h or with 500 µM H2O2 used as a positive control. ROS overproduction was evaluated by flow cytometry (upper part). The percentages of DHE+ cells (overproducing superoxide anion O2−) are indicated by the histograms (lower part). (B) Cells were treated or not with 400 µM Vit E for 2 h then, treated for 24 h with 5,6 α-EC or 5,6 β-EC (40–80 µg/mL). The inhibition of death induced by 5,6-ECs was evaluated by the percentage of PI+ HMCLs presented as means ±SD. Statistical t-tests were used to calculate the p-values between 5,6 α/β-ECs-treated cells vs. vehicle-treated cells or between 5,6 α/β-ECs- vs. 5,6 α/β-ECs + Vit E-treated cells (* p < 0.05; ** p < 0.01; *** p < 0.001) (Table S8). No statistically significant difference between control and vehicle (EtOH) was noticed.

