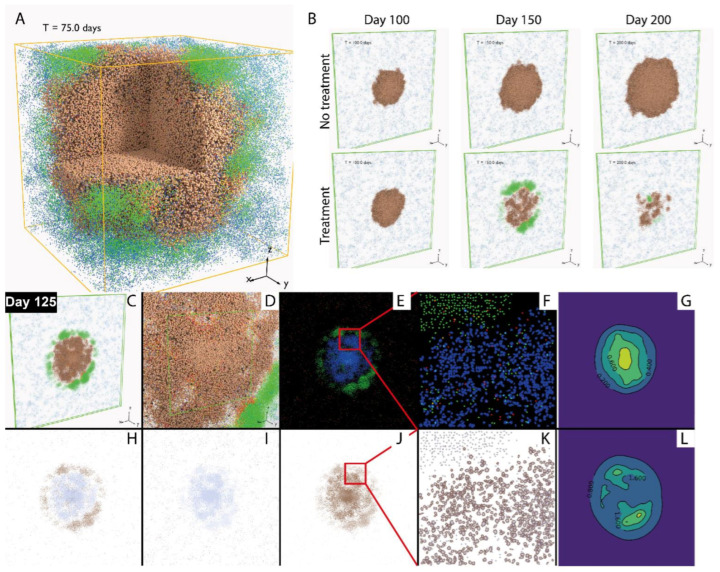
Figure 4.
Visualization of spatio-temporal tumor dynamics. (A) Simulated tumor in 3 × 3 × 3 mm volume. Cancer cells: brown: progenitor cells; red: cancer stem cells (CSC); grey: senescent cells; T cells: blue: Tregs; green, red, and yellow: CD8+ T cell, as newly recruited, enhanced, and exhausted states. (B) Simulated tumor in 10 × 10 × 0.2 mm volume, with or without anti-PD-1 treatment. (C–L) Snapshots of tumor at day 125 after treatment began. (C) 3D visualization. (D) Close-Up 3D visualization of cells. (E) Virtual multiplex immunofluorescence (mIF) (red: Treg; blue: cancer cells; green: Teff). (F) Close-Up virtual mIF. (G) Simulated IL-2 concentration distribution, ng/mL. (H) Virtual immunohistochemistry (IHC), CD8+. (I) Virtual IHC, FoxP3+. (J) Virtual IHC, PD-L1+. (K) Close-Up of J. (L) Simulated IFNγ concentration distribution, ng/mL.

