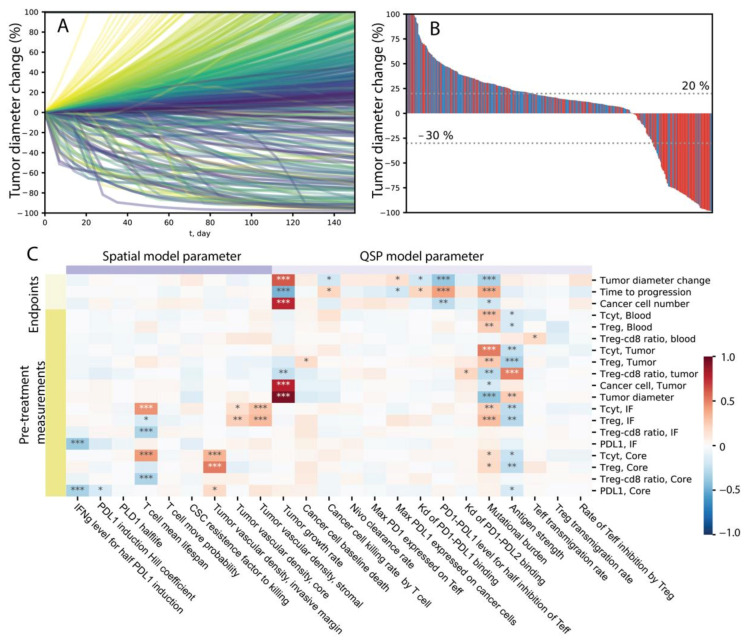
Figure 5.
Response to treatment in a virtual cohort and parameter sensitivity. (A) Tumor diameter change, relative to diameter prior to first drug administration. Colors correspond to tumor growth rate, with red representing high growth rate and purple representing low growth rate. (B) Best response measured as minimum tumor diameter changes from 8 weeks after the first drug administration. Colors represent tumor mutational burden, where red indicates the patient has a mutational burden higher than median value among the cohort and blue indicates a mutational burden lower than median. (C) PRCC of simulation output against different parameters. *, ** and *** indicate p-values smaller than 10−3, 10−6 and 10−9.

