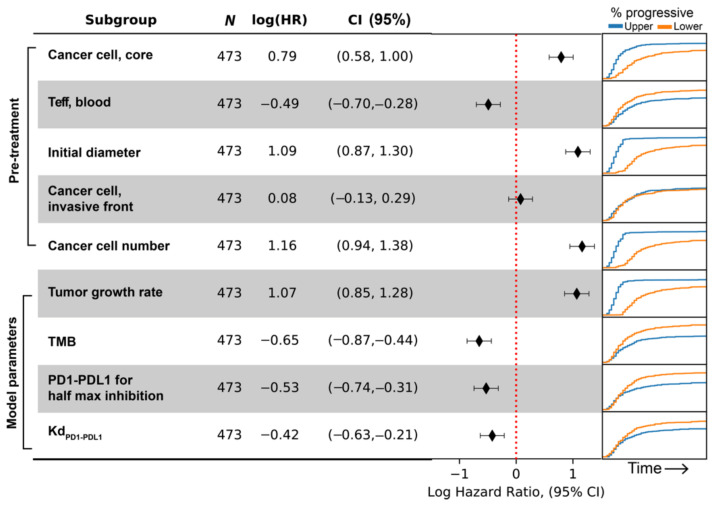
Figure 11.
Hazard-ratio of progression in patient subgroups based on indicated biomarkers. On the right-hand side, the proportion of patients whose tumor have progressed is plotted against time after treatment started. Blue and orange corresponds to the upper and lower half of the virtual population with regard to each biomarker.

