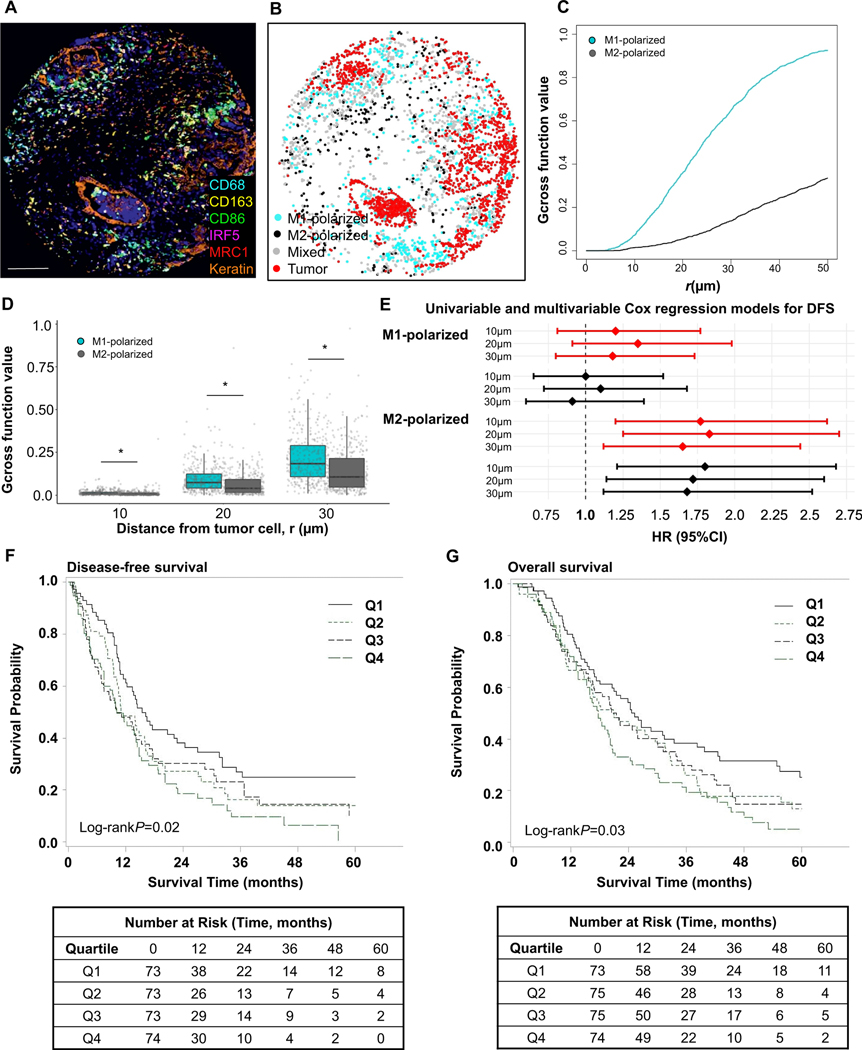
Figure 4. Spatial analyses of M1-polarized and M2-polarized macrophage populations with Gcross function.
Examples of multiplex immunofluorescence image (A), corresponding phenotype map with M1- and M2-polarized macrophages (B), and Gcross (Gtumor:M1 and Gtumor:M2) function plot (C). Boxplot of the comparison between Gtumor:M1 and Gtumor:M2 function values at 10μm, 20μm and 30μm radii. P values were calculated with Wilcoxon sum-rank test. *P <0.001 (D). Higher Gtumor:macrophage values indicate higher densities of macrophages located close to tumor cells. M1-polarized macrophages are located closer to tumor cells than M2-macrophages at all radii evaluated up to 50 μm. Forest plot of univariable (red) and multivariable (black) Cox regression models for disease-free survival (DFS) according to Gcross spatial measurements between tumor cells and M1- and M2-polarized macrophages. HRs are for the top compared to the bottom quartile; closer location of M2-polarized macrophages to tumor cells was associated with worse patient outcomes, while this association was not identified for M1-polarized macrophages (E). Kaplan-Meier disease-free survival (F) and overall survival (G) curves according to Gtumor:M2 function values within 20μm. P values were calculated with log-rank test. The scale bar is 200 μm.

