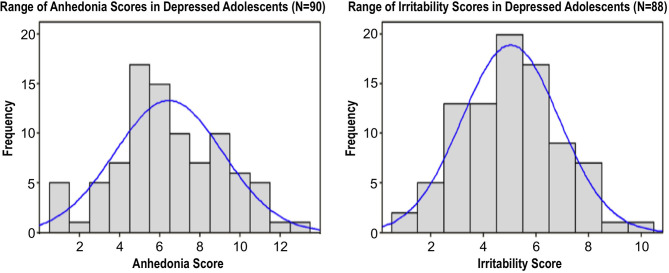
Figure 1.
Distribution of anhedonia scores (derived from 1 CDRS-R and 2 BDI questions, range: 1-13) and irritability scores (derived from 1 CDRS-R and 1 BDI question, range: 1-10) in a sample of 90 depressed adolescents. Histograms superimposed with corresponding normal distributions. Adapted from (54).

