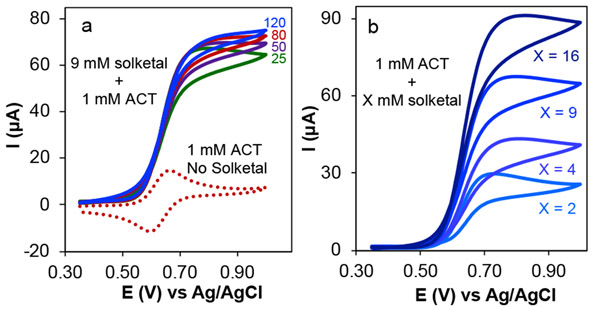
Figure 4.
Cyclic voltammograms of 1.0 mM ACT in the absence (dotted line) and presence of 9 mM solketal at different scan rates (25–120 mV s−1) (a), and cyclic voltammograms of 1.0 mM ACT in the presence of various concentrations of solketal (b). Scan rate for dotted trace is 80 mV s−1 and for traces in (b) is 25 mV s−1. Solution conditions: aqueous solution with NaHCO3/Na2CO3 electrolyte 0.1/0.1 M, and pH 10.

