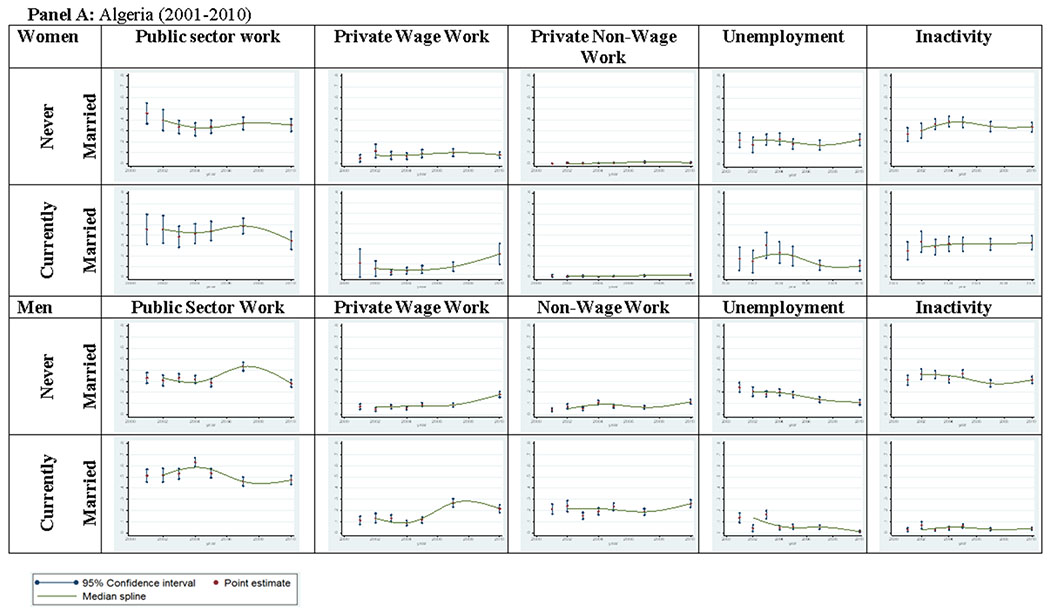
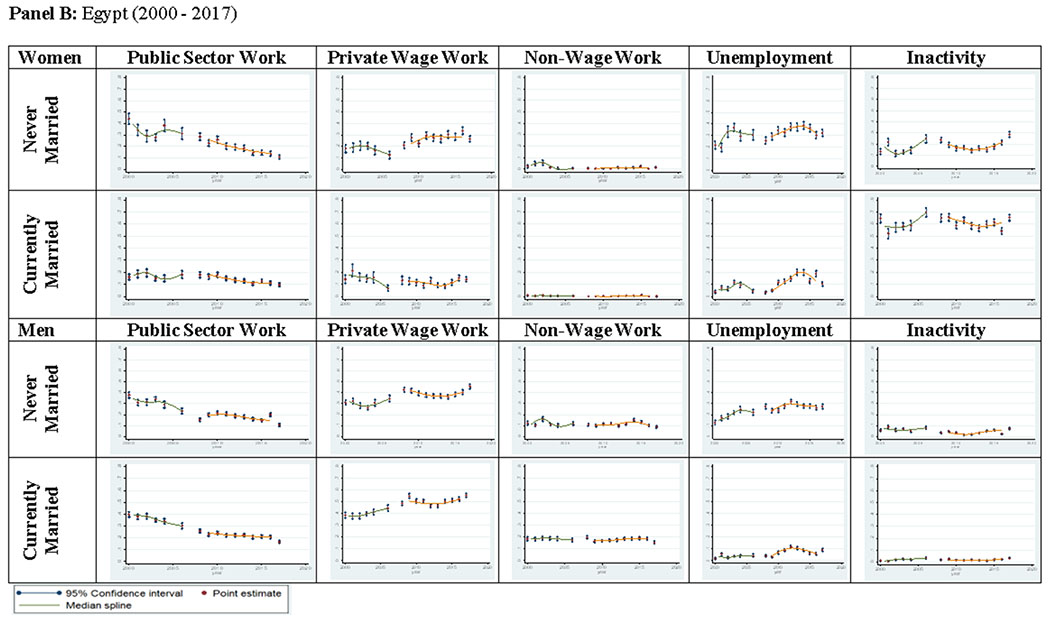
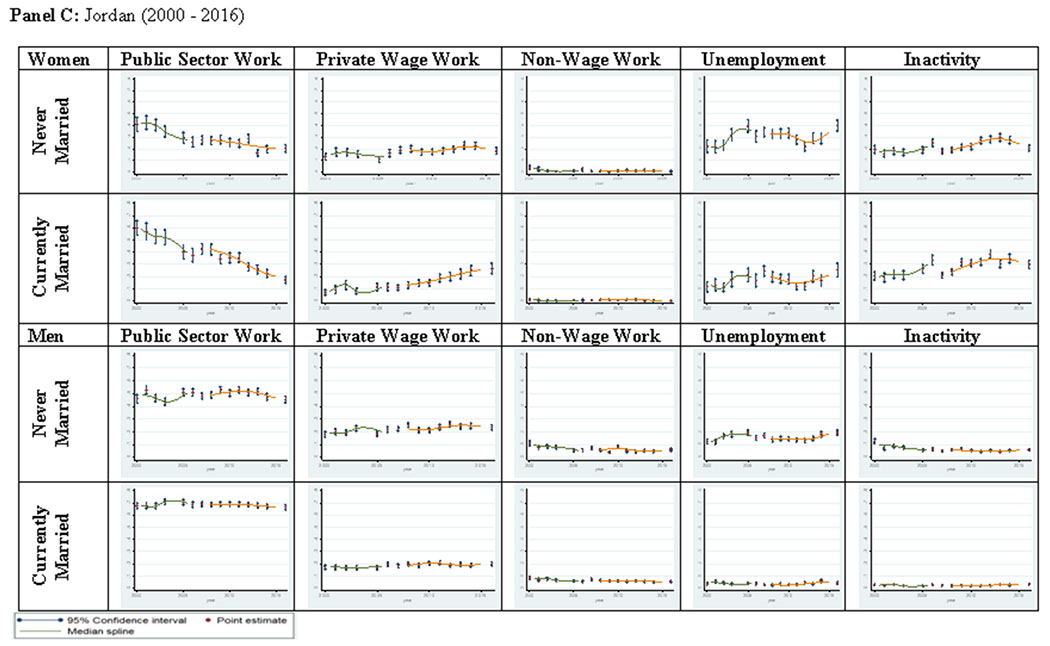
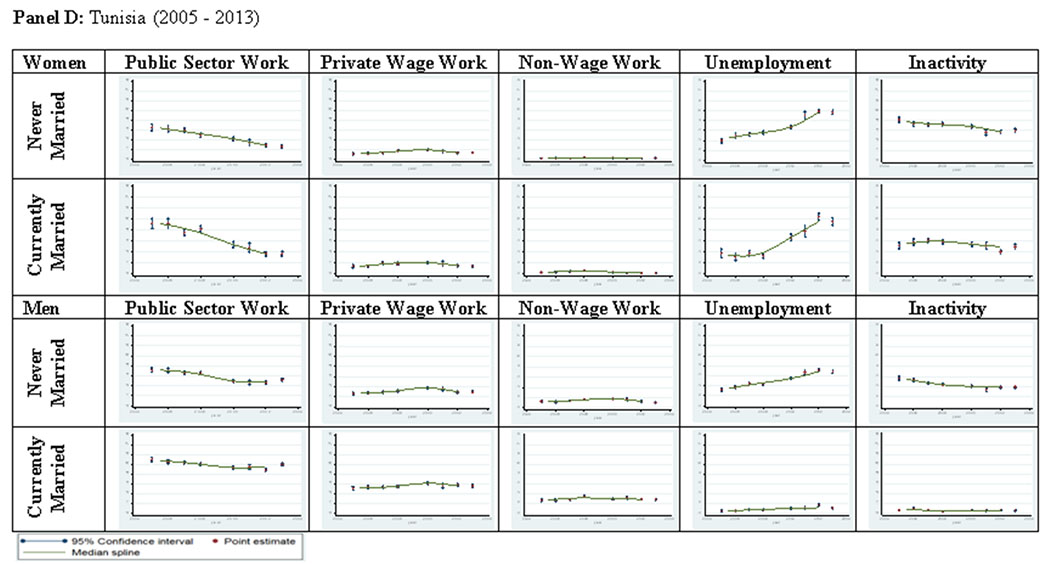
Figure 4:


Simulated Probabilities of Labor Market States for a 25-Year Old University Educated Female and Male, by Marital Status and Country
Source: Based on simulations conducted using multinomial logit models on data from official labor force surveys in each of the four countries. See data and methods section in text for details.
Note: Simulations are carried out for a 30-year old university-educated female or male residing in an urban area in the region of her/his country that includes the capital city. Four-period splines are used to smooth fluctuations in the simulation results.
