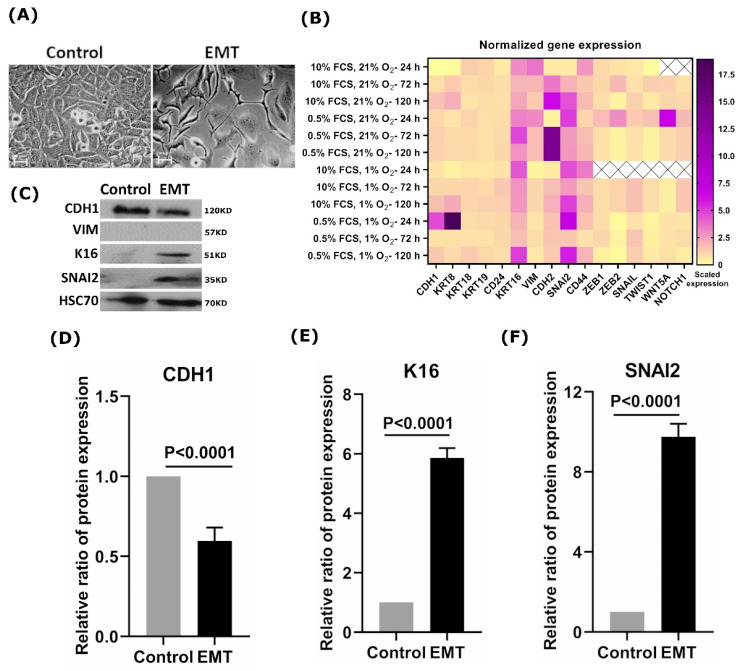
Figure 2.
Analysis of the K16 expression in EMT-induced cells. (A) Microscopic images showed morphological changes in MCF7 cells during EMT induction; scale bar represents 100 μm. (B) Heat-map of EMT/MET specific genes expression in EMT-induced cells at different culture conditions and time points; relative mRNA expression values were normalized to GAPDH and subsequently displayed relative to gene expression as a fold change 2−(∆∆CT). (C) Protein expression profile of K16, CDH1, VIM, and SNAI2 during EMT induction on MCF7 cells. HSC70 was used as a reference control. The relative ratio of protein expression of (D) CDH1; (E) K16; (F) SNAI2.

