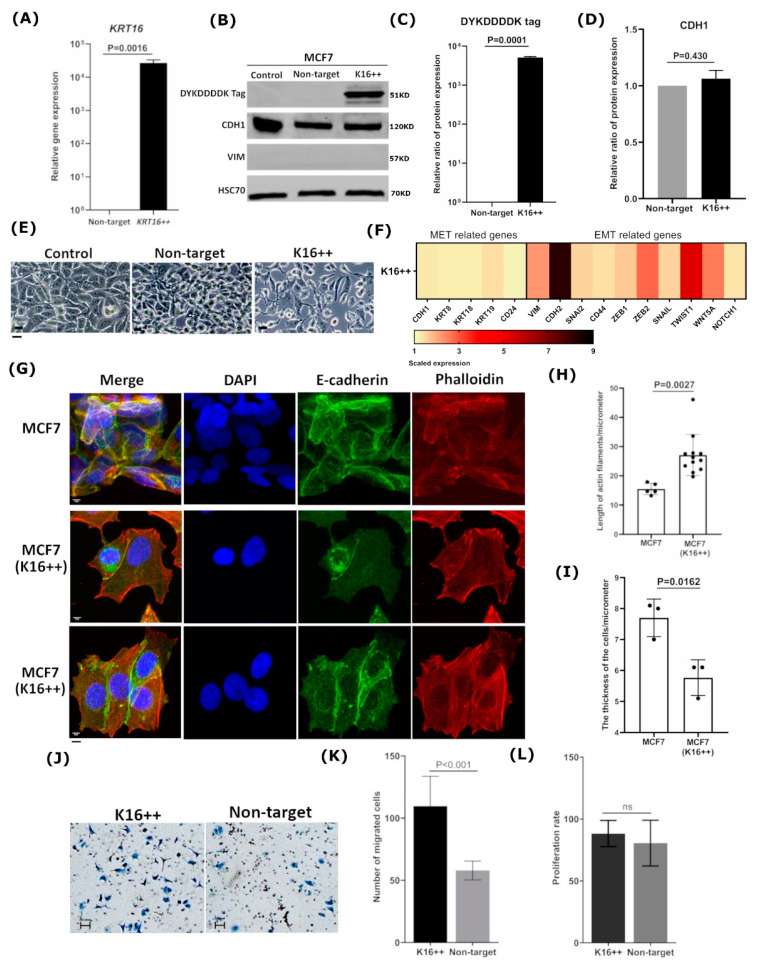
Figure 3.
Overexpressing of K16 in MCF7 cells promotes a mesenchymal phenotype. (A) Relative mRNA expression was verified after inducing KRT16. (B) Immunoblot: DYKDDDDK tag was used to detect the expression of transfected K16 in MCF7 cells (K16++) compared to transfected empty vector (non-target) and untreated cells (control); CDH1 and VIM expression were investigated after 48h of treating MCF7 cells, loading control: HSC70. The relative ratio of protein expression of (C) DYKDDDDK tag and (D) CDH1. (E) Cellular morphological changes in MCF7 cells after inducing the expression of K16 protein (K16++) were observed under a normal microscope compared to transfected non-target and untreated cells (control); scale bars 20 μm. (F) Heat-map of EMT/MET-specific genes was investigated after KRT16 enhancement; mRNA expression values were normalized to GAPDH and subsequently displayed relative to gene expression as a fold change 2−(∆∆CT). (G) Immunocytochemistry staining of actin filaments by phalloidin (red), intercellular adhesion by E-cadherin (green), and nucleus by DAPI (blue) to visualize the morphological changes in MCF7 cells that induced K16; scale bar represents 5 μm. Differences between MCF7 cells and MCF7 cells with induced K16 in (H) the length of actin filaments and (I) the thickness of the cells. (J) Microscopy images of migrated cells by Boyden Chamber to analyze the motility of MCF7 cells overexpressing K16 relative to the non-target control; the cells were seeded on transwell chambers and incubated for 24 h; scale bar represents 100 μm. (K) The migrated cells were counted after staining cells with crystal violet, the data were generated as the mean ± SD., n = 3. (L) Proliferation assay: cell proliferation rates of K16++ and non-target control cells were determined using Trypan Blue Dye, and the cells were counted by Vi-CELL Counter device; the data are expressed as the mean ± SD.; n = 3. The p-values were calculated with Welch’s two sample t-test (p < 0.05).

