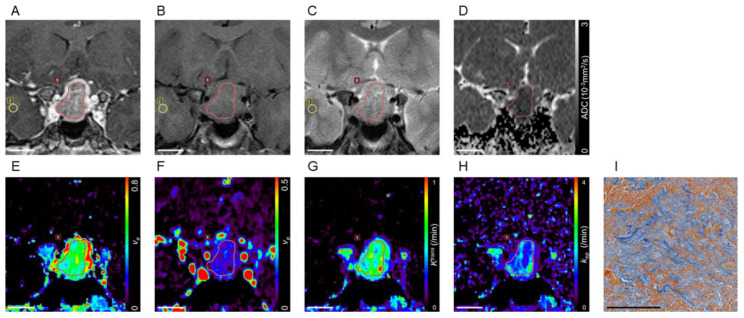
Figure 2.
Pituitary adenomas with hard consistency. A contrast-enhanced coronal T1-weighted image of a pituitary adenoma extending into the suprasellar cistern (A). The adenoma is slightly hypointense in the white matter on the T1-weighted image (rT1 = 0.931; B) and hyperintense on the T2-weighted image (rT2 = 1.71; C). The corresponding ADC map shows a low ADC value (0.674 × 10⁻³mm2/s; D). Pharmacokinetic parametric mapping shows a high ve value (0.440; E), a low vp value (0.050; F), a high Ktrans value (0.615/min; G), and a low kep value (1.410/min; H) in the adenoma. Region of interests for tumor and normal-appearing white matter are indicated by red and yellow lines, respectively. Azan-stained section of tumor at pathologic examination shows abundant collagen in the stromal fibrous tissue in blue and small tumor cells in red (PCC = 50.9%; I). Bar indicates 20 mm (A–H), 200 μm (I). rT1: ratio of signal intensity on T1-weighted MRI; rT2: ratio of signal intensity on T2-weighted MRI; ADC: apparent diffusion coefficient; ve: volume of extravascular extracellular space per unit volume of tissue; vp: blood plasma volume per unit volume of tissue; Ktrans: volume transfer constant between blood plasma and extravascular extracellular space; kep: rate constant between extravascular extracellular space and blood plasma; PCC: percentage of collagen content.

