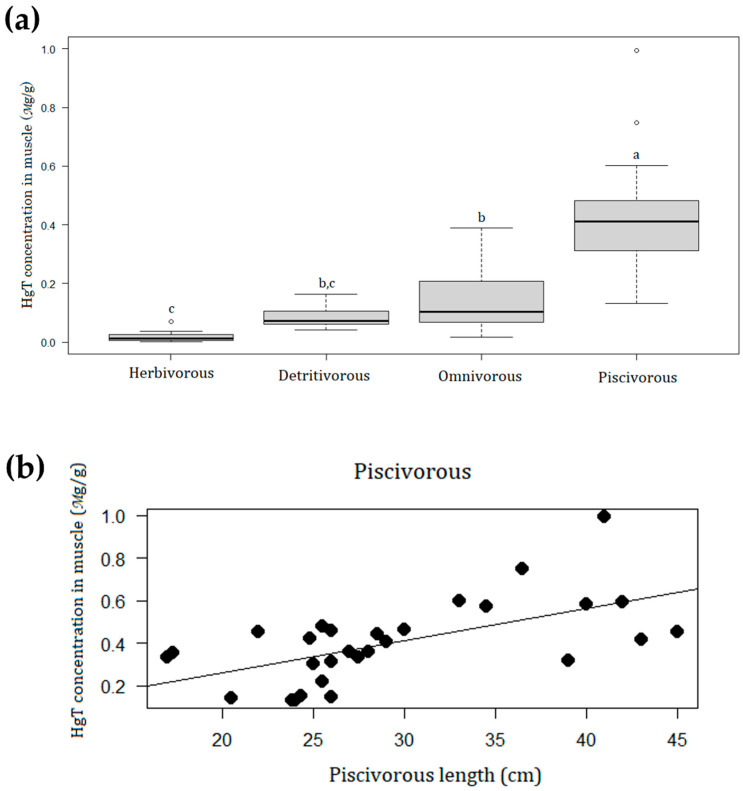
Figure 1.
(a) Concentrations of mercury total (µg/g) in the muscle tissue of fish sampled (n = 88) compared among different trophic levels. Median (darker line in the box plot), minimum and maximum values (vertical lines), and outer lines of boxplot (25% and 75%). Dunn test: a > b > c, p < 0.05. Circles are outliers. (b) Linear regression between standard length (cm) of piscivorous fish (n = 29) and the concentration of mercury total (µg/g) in the muscle tissue of fish (y = −0.041 + 0.0151X; R2 = 0.36; F = 15.4; df = 27; p = 0.0005). One individual of Piranha-preta (Serrasalmus rhombeus) was excluded from the analysis to maintain normality and homogeneity of variances.

