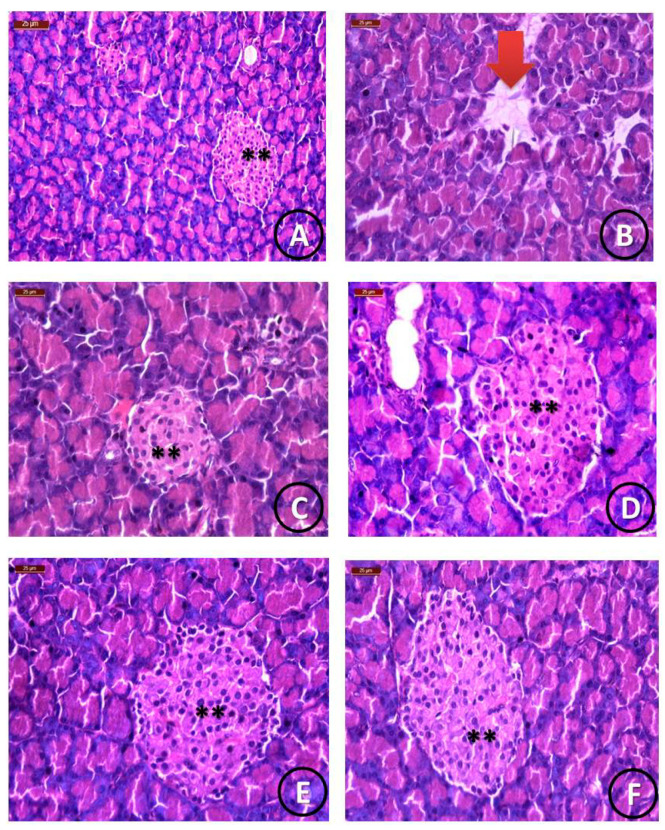
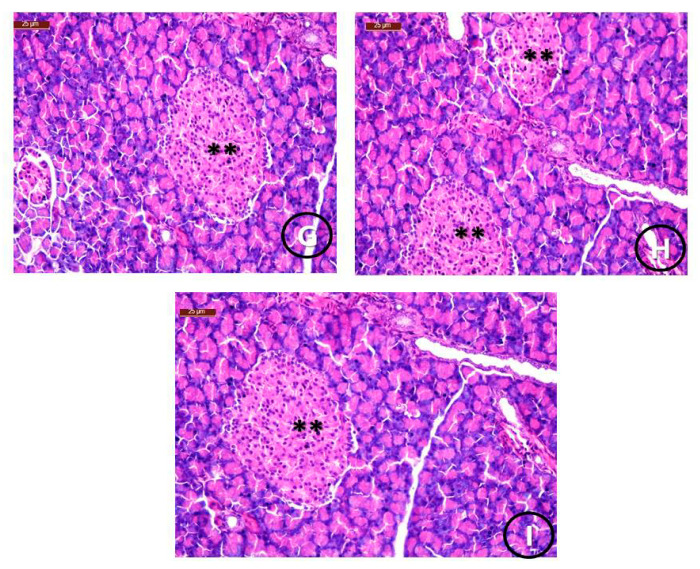
Figure 6.
Histological photomicrographs of pancreatic tissues. (A) Normal pancreatic parenchyma and the normal appearance of islets of Langerhans (**) (scale bar = 25 µm). (B) STZ group showing detached pancreatic parenchyma (**) with the disappearance of islets of Langerhans (red arrow) (scale bar = 25 µm). (C) STZ and STG group showing the restoration of detached pancreatic parenchyma with moderately sized islets of Langerhans (**) (scale bar = 25 µm). (D–I) STZ and Mg, Cu, Zn, Ca, Cr, and Se/STG groups showing normal pancreatic parenchyma (with the appearance of islets of Langerhans (**) that were greatly enlarged in groups D and F) and enlarged pancreatic islets in group H, which was treated with the Cr/STG novel complex (scale bar = 25 µm).


