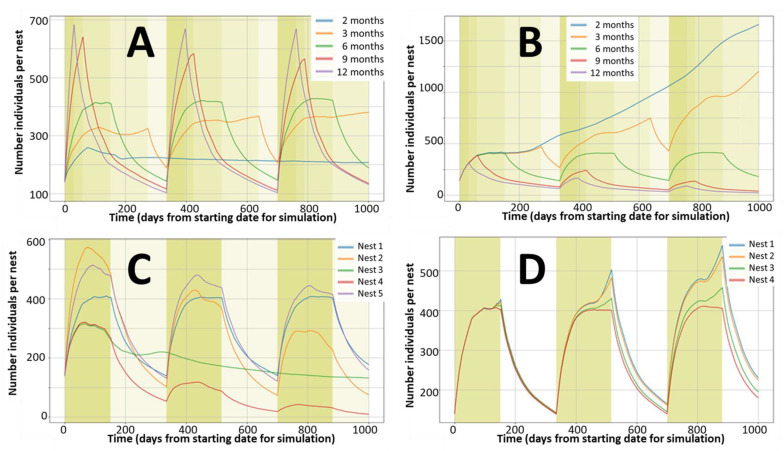
Figure 4.
Examples of abundance simulations for different reproduction and mortality conditions for nests with similar initial densities (140 rabbits per nest). (A): Reproductive seasons of 2, 3, 6, 9, or 12 months per year with similar adjusted annual reproduction rates. (B): Reproductive seasons of 2, 3, 6, 9, or 12 months per year with similar monthly reproduction rates. (C): Effects of different combinations for mortality and reproduction (Nest 1 default monthly values of 0.11 for mortality and 4.0 for reproduction with reproduction season of 6 months; Nest 2 rates of 0.22 for mortality and 8.0 for reproduction with reproduction season of 6 months; Nest 3 rates of 0.22 for mortality and 4.0 for reproduction with reproduction season of 12 months; Nest 4 rates of 0.22 for mortality and 4.0 for reproduction with reproduction season of 6 months; Nest 5 rates of 0.16 for mortality and 6.0 for reproduction with reproduction season of 6 months). (D): Effect of adding reproductive capacities to the subadult (A2) female group (reproduction rate for A2 of 4.0, 3.0, 2.0, and 0.0 for nests 1, 2, 3, and 4 respectively).

