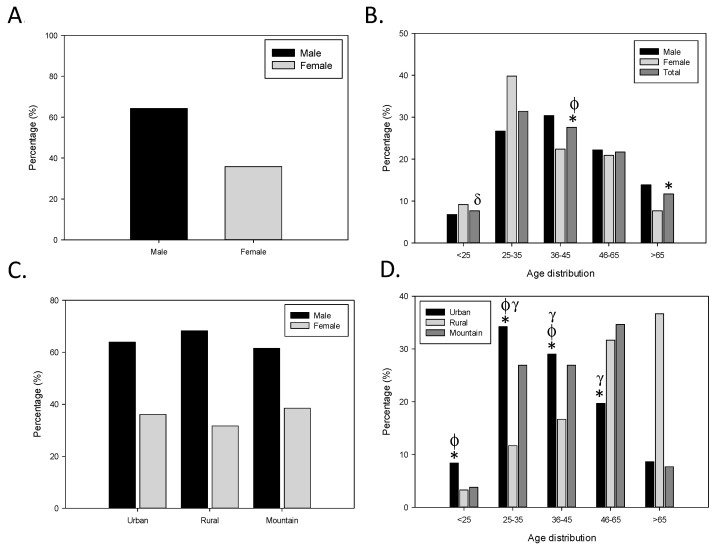
Figure 1.
Patient and pharmacy distribution profile. Distribution of participants according to (A) sex, (B) age and sex, (C) type of pharmacy and sex and (D) type of pharmacy and age of the participants. The proportions are calculated from each condition related to 548 notifications analysed. Patient distribution profile was not equally distributed among sexes, age or type of pharmacies. These differences were even more clear when the age and type of pharmacy analysis was performed together. Statistical differences: (B) * p < 0.05 vs. range 25–35, ɸ p < 0.05 vs. range < 25, δ p < 0.05 vs. range > 65 and (D) * p < 0.05 U/R in range > 65, ɸ p < 0.05 U/R vs. range 46–65, γ p < 0.05 R/M in range > 65.

