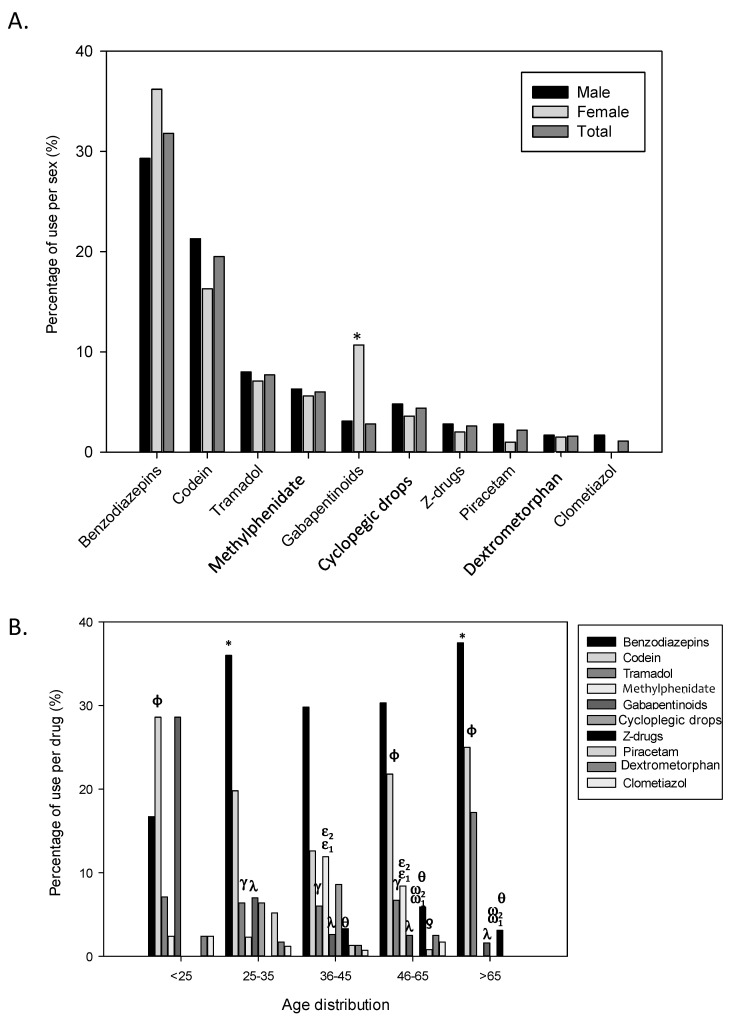
Figure 2.
Proportion of the type of drug. Distribution of the participants according to (A) type of drug and sex and, (B) type of drug and age. The proportions are calculated from each condition related to 548 notifications analysed. As it can be observed the drug abuse was also differentially distributed by age and different patterns were obtained for specific drugs and ages. Statistical differences: (A) * p < 0.05 vs. men and (B) * p < 0,05 vs. range < 25 in benzodiazepins group, ɸ p < 0.05 vs. range 36–45 in codein grup, γ p < 0.05 vs. range > 65 in tramadol group, ε1 p < 0.05 vs. range 25–35; ε2 p < 0.05 vs. range > 65 in methylphenidate group, λ p < 0.05 vs. range < 25 in gaba group, ω1 p < 0.05 vs. range 25–35; ω2 p < 0.05 vs. range 36–45 in cicloplegic, θ p < 0,05 vs. range 25–35 in z-drug group, ƍ p < 0.05 vs. range 25–35 in piracetam group.

