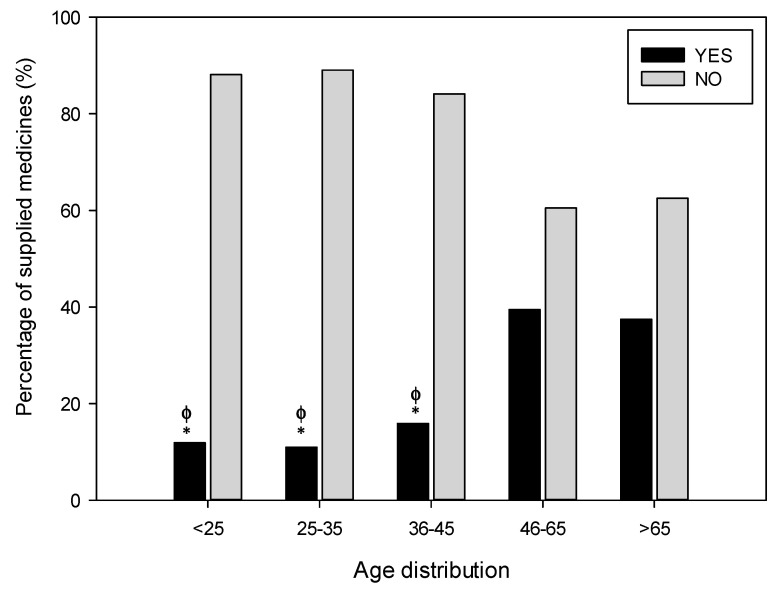
Figure 4.
Distribution of the supplying behaviour according to the age of the abuser. The proportions are calculated from each condition related to 548 notifications analysed. It can be observed that the pharmacist supplies the request drug more frequently at older ages. Statistical differences: * p < 0.05 vs. range >65, ɸ p < 0.05 vs. range 46–65.

