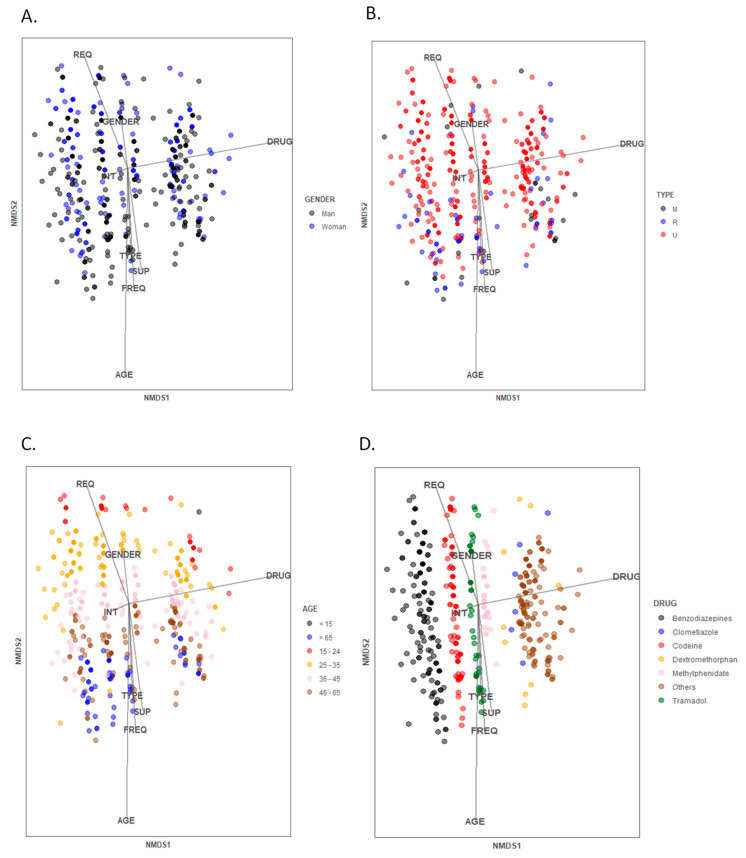
Figure 5.
Distribution of the studied population analysed by non-metric multidimensional scaling (NMDS). Different influencing characteristics of the participants are depicted in colours: (A) gender, (B) type of pharmacy, (C) age and (D) type of drug requested. The vectors correspond to the variables analysed together: GENDER, DRUG, TYPE (type of pharmacy), SUP (whether the drug is supplied or not), INT (request with intimidation), FREQ (frequency demanding the drug) and AGE. The analysis includes the 548 notifications. It can be observed the clustering of the users depending on the stablished parameters being the age and type of drug the clearest influent factors.

