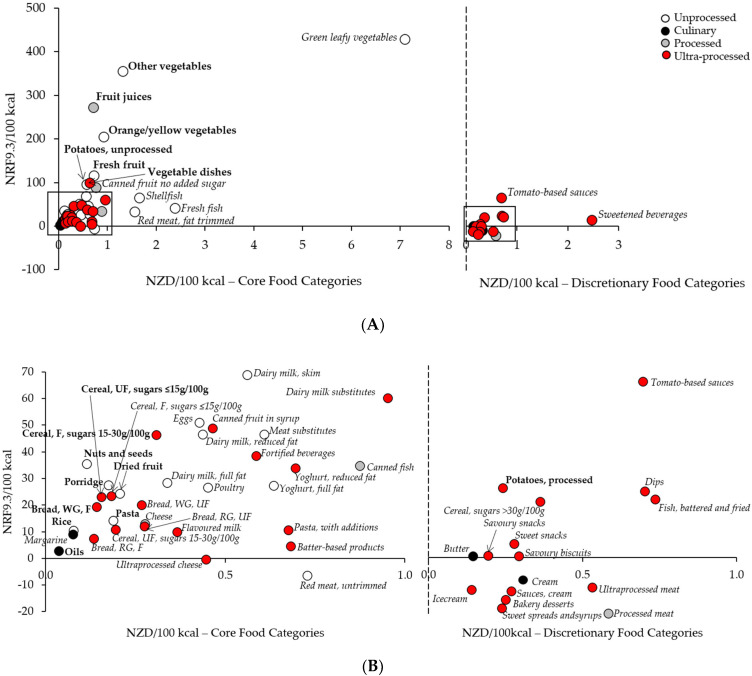
Figure 2.
Nutrient density (NRF9.3 per 100 kcal) vs cost (NZD per 100 kcal) for the 61 NZ food categories (A) Complete graph showing the relationship between nutrient density and cost for all 61 food categories, separated as core or discretionary food categories. The majority of food categories are clustered with an NRF 9.3/100 kcal less than 70 and a cost (NZD)/100 kcal) less than NZD 1.0 (boxed areas). (B) Enlargement of the clustered food categories contained within the boxes in Figure 2A for each core and discretionary food category. For both A and B, the food categories appearing in the highest quartile of the nutrient density-to-cost ratio are shown in bold, and food categories in quartiles 2–4 are in italics. Unprocessed food categories are shown as white circles, culinary processed as black circles, processed as grey circles, and ultra-processed as red circles. Figure abbreviations: F, fortified; RTE, ready-to-eat; RG, refined grain; UF, unfortified; WG, wholegrain. Potatoes, unprocessed: includes unprocessed potatoes and red kumara; Potatoes, processed: includes processed potatoes and red kumara.

