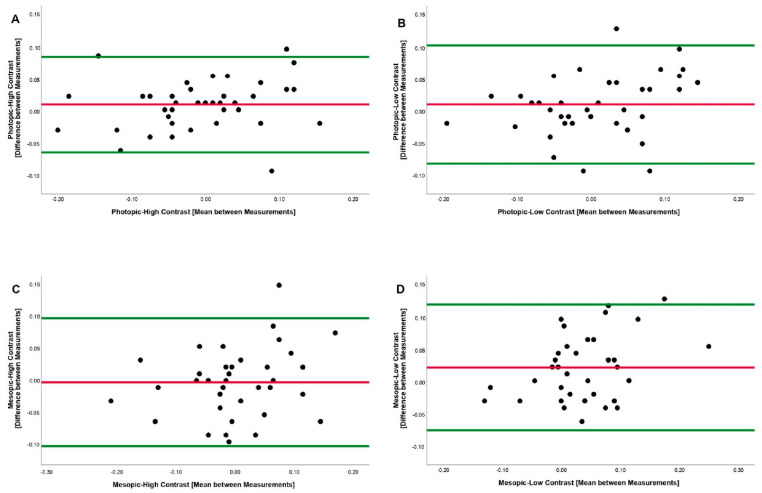
Figure 1.
Bland–Altman plots between the measurements of VA. (A) Photopic and High Contrast; (B) Photopic and Low Contrast; (C) Mesopic and High Contrast; (D) Mesopic and Low Contrast. The central line indicates the mean between measurements. The external lines indicate limit of the 95 % agreement superior and inferior.

