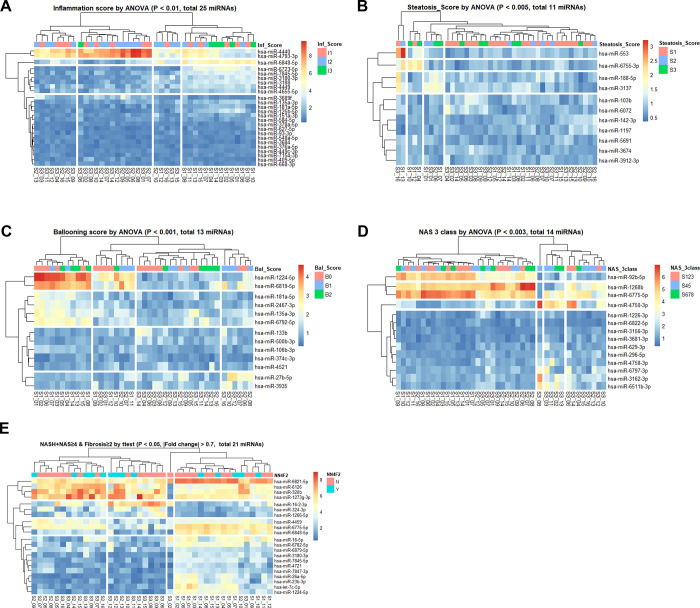
Fig 1. Expression profile heatmaps of five variables.
Heatmaps of differentially expressed miRNAs (rows) from 41 patients (columns). At the top of each row, the scoring levels of 2 or 3 for each of the five variables are presented in the bar. Each row indicates identified miRNAs by the t-test or analysis of variance, and each column indicates a patient. Each row and column pair was clustered using the k-means clustering method with the package “pheatmap” in R and divided into four sections.

