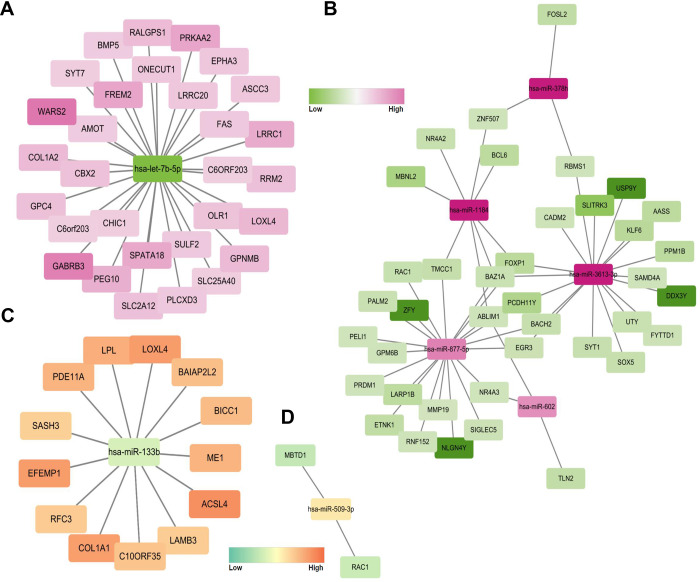
Fig 4. Network analysis of mRNA–miRNA interactions with the GSE89632 dataset.
A network between a less expressed miRNA (our data) and a more expressed gene (GSE89632) (A), and between a more expressed miRNA (our data) and a less expressed gene (GSE89632) (B) in people with high fibrosis. The closer to green, the less expressed (that is, more likely to be affected by miRNA), and the closer to pink, the more expressed. A network between a less expressed miRNA (our data) and a more expressed gene (GSE89632) (C), and between a more expressed miRNA (our data) and a less expressed gene (GSE89632) (D) in people with high NAS. The closer to green, the less expressed (that is, more likely to be affected by miRNA), and the closer to orange, the more expressed.

