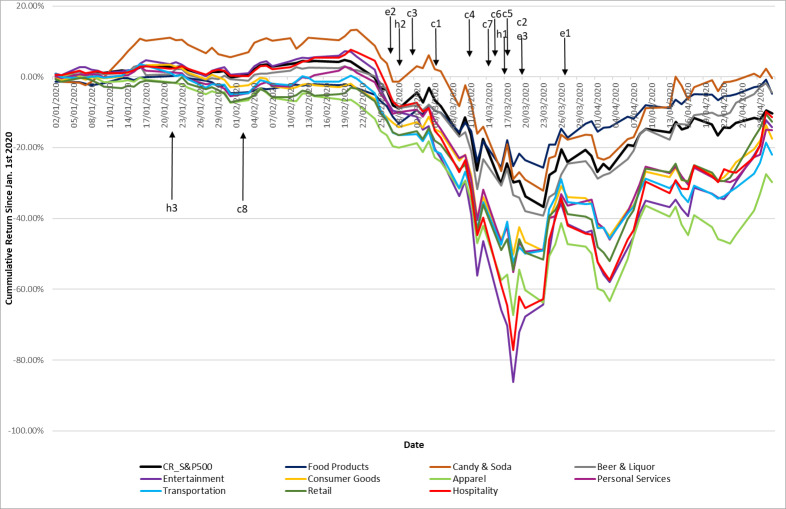
Fig 1. Comparison of the cumulative returns of the S&P 500, the hospitality industry and its related industries indexes.
A. The figure depicts the cumulative returns of the S&P 500, the hospitality industry and the indices of numerous related industries since the outbreak of COVID-19 in January 2020. “c,” “e” and “h” denote closures, economic and health measures, respectively.

