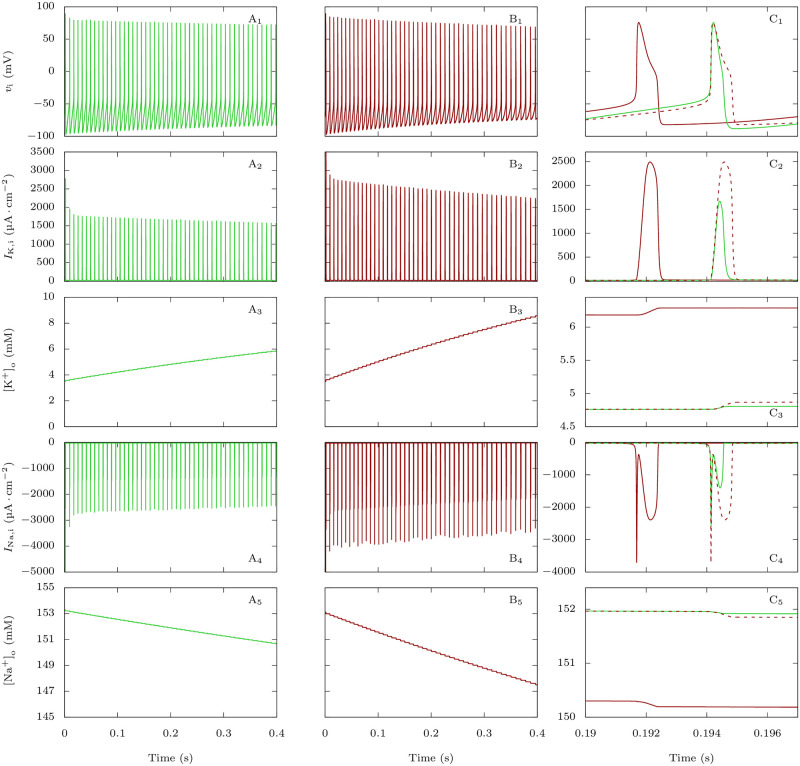
Fig 3. Effect of FHM-3 mutations on the firing and action currents of the GABAergic neuron, and correlation with the dynamics of [K+]o and [Na+]o.
Plots of the voltage (action potentials; upper row), total potassium current (second row), extracellular potassium concentration (third row), total sodium current (fourth row) and extracellular sodium concentration (bottom row) corresponding to simulations displayed in Fig 2, for the condition in which gD,i = 0.3 mS · cm−2. A: No persistent sodium current: pNa,P = 0%. B: pNa,P = 20%. C: Zoom showing the 25th action potential of A (in green) and B (in red). The dashed lines are the curves obtained with pNa,P = 20% shifted to allow a better comparison with the curves obtained with pNa,P = 0%.

