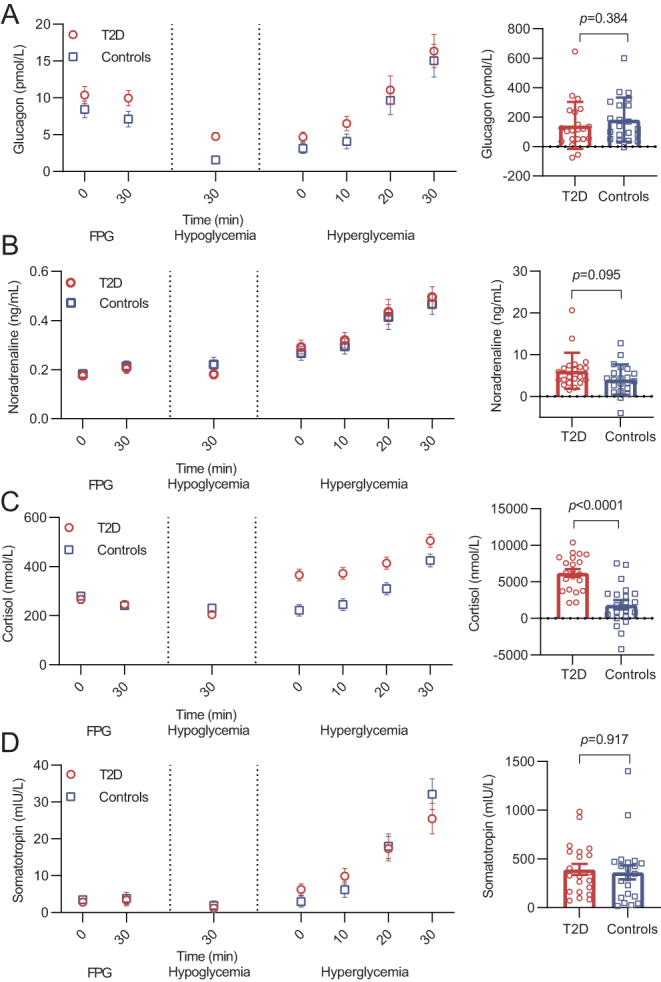
Figure 3.

Hormonal counterregulatory response. Levels of (A) glucagon, (B) noradrenaline, (C) cortisol and (D) somatotropin during each steady-state phase of the experimental day in patients with type 2 diabetes (red circles) and controls (blue squares). On the left side, levels of the respective counterregulatory hormones during the clamp procedure are depicted (mean ± s.e., n = 21 (both groups)). On the right side, hormonal counterregulatory response during the hypoglycemic phase is depicted as baseline subtracted area under the curve with the hyperglycemic phase applied as baseline and differences between groups evaluated by an unpaired t-test. FPG, fasting plasma glucose; T2D, type 2 diabetes.

 This work is licensed under a