
. 2021 Jun 3;185(2):343–353. doi: 10.1530/EJE-21-0232
 This work is licensed under a
 Figure 4.
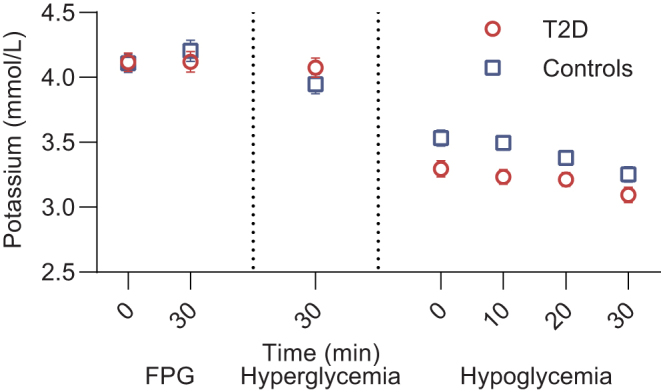
Plasma potassium. Levels of plasma potassium (mean ± s.e., n = 21 in both groups) during each steady-state phase of the experimental day in patients with type 2 diabetes (red circles) and controls (blue squares). FPG, fasting plasma glucose; T2D, type 2 diabetes.