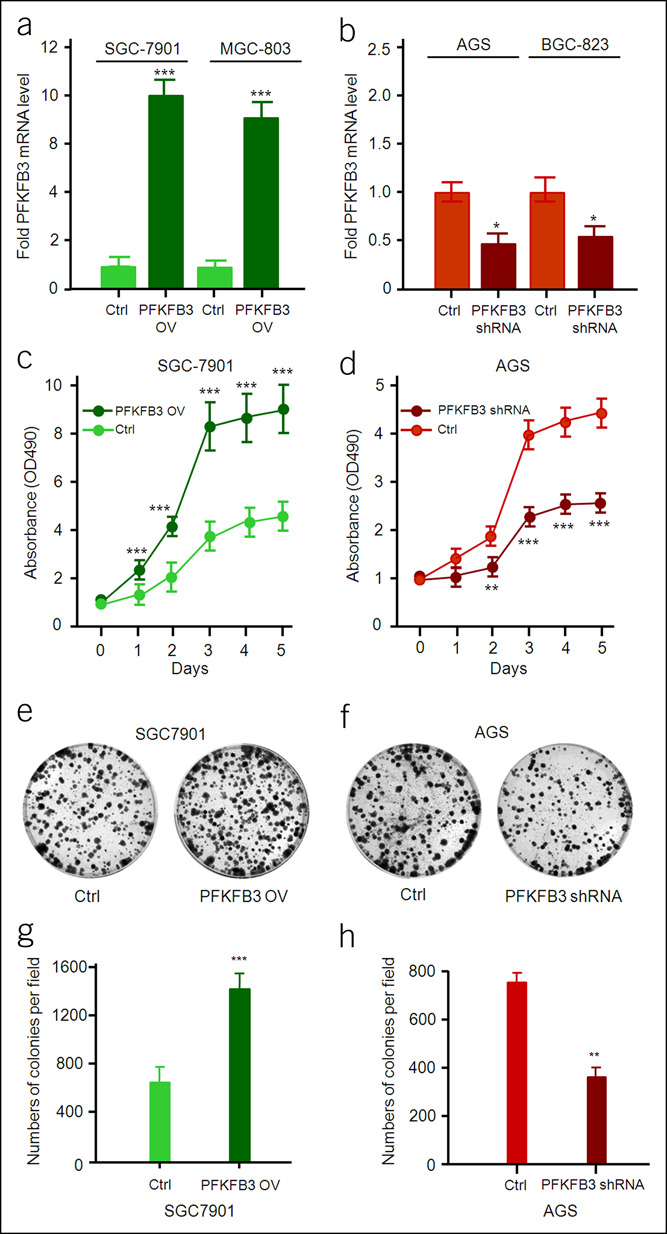
Figure 3.

Effect of PFKFB3 on proliferation of gastric cancer cells. The mRNA level of PFKFB3 in PFKFB3-overexpressing or PFKFB3-specific shRNA gastric cancer cells was detected by quantitative RT-PCR. All data are shown as mean ± SD and *P < 0.05; ***P < 0.001 (a and b). The cell growth rate was measured by MTT assay with OD490 nm in gastric cancer cells (PFKFB3-overexpressing or PFKFB3-specific shRNA). All data are shown as mean ± SD and **P < 0.01; ***P < 0.001 (c and d). The colony formation assay in gastric cancer cells (PFKFB3-overexpressing or PFKFB3-specific shRNA) (e and f). All data are shown as mean ± SD and **P < 0.01; ***P < 0.001 (g and h). RT-PCR, reverse transcription polymerase chain reaction.
