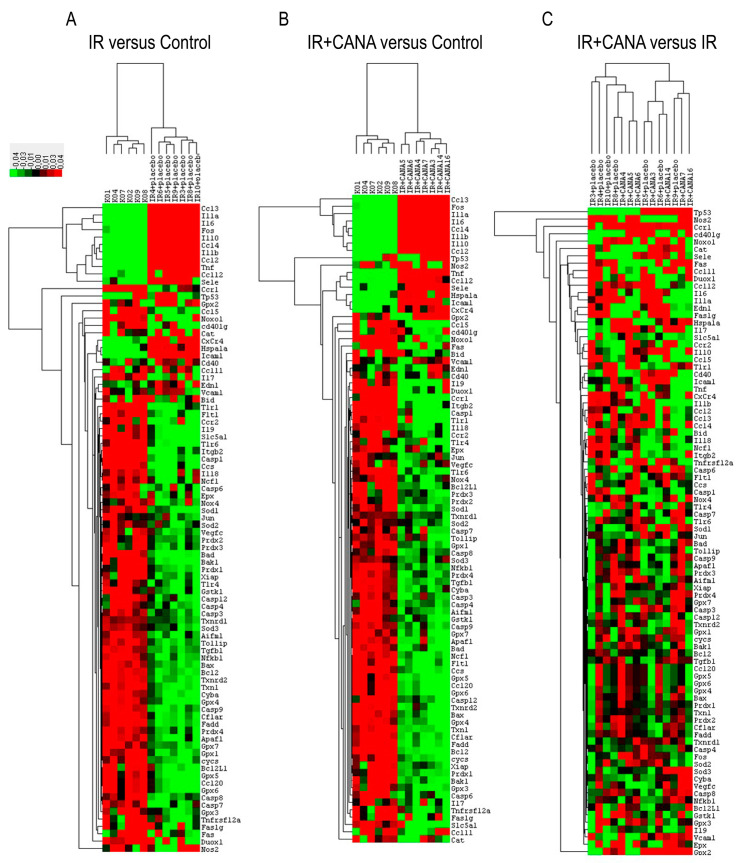
Figure 2.
Changes in gene expression caused by vascular ischemia/reperfusion (IR) injury and the effect of canagliflozin (CANA). The expression of 88 genes involved in inflammation, apoptosis, and oxidative stress has been profiled. Clustergrams create a heat map with dendograms to indicate which genes are coregulated. Degrees of red and green indicate relatively high and low expression of the corresponding gene, respectively, and black squares denote genes equally expressed. (A) IR vs. Control, (B) IR + CANA vs. Control, and (C) IR + CANA vs. IR groups. The x-axis indicates number of rats (“KO” corresponds to the Control group, including six rats (KO1, KO2, KO4, KO7, KO8, KO9), “IR + placebo” corresponds to the IR group, including seven rats (IR3 + placebo, IR4 + placebo, IR5 + placebo, IR6 + placebo, IR8 + placebo, IR9 + placebo, IR10 + placebo), and “IR + CANA” corresponds to the IR + canagliflozin group, including seven rats (IR + CANA3, IR + CANA4, IR + CANA5, IR + CANA6, IR + CANA7, IR + CANA14, IR + CANA16)) and the y-axis indicates the genes. n = 6–7 rats/group. See Table 1 for genes’ abbreviations.

